PEO4YOU

Author: Sam Newland

  • Nonprofit Employee Benefits Administration: How Broker Errors Drain Your Limited Resources

    Nonprofit Employee Benefits Administration: How Broker Errors Drain Your Limited Resources

    Nonprofit organizations face a unique challenge: delivering maximum impact for their mission while operating under tight budget constraints. Yet many nonprofits unknowingly drain precious resources through inefficient benefits administration riddled with broker errors, manual processes, and hidden costs that compound over time.

    A Massachusetts nonprofit administrator managing two organizations with approximately 80 employees recently shared her frustration with persistent enrollment errors from their current broker. Misspelled names, missed dependents, and former employees lingering on invoices month after month created an administrative nightmare that consumed hours of valuable time better spent on mission-critical work. The situation became so overwhelming that the organization had to hire an HR Generalist at $60,000 to $70,000 annually just to regain administrative capacity.

    This scenario plays out across the nonprofit sector, where limited staff and resources make every hour and every dollar count. According to the Bureau of Labor Statistics, nonprofit organizations employ 12.8 million people, representing 9.9 percent of all private sector jobs.1 However, Independent Sector research shows that 22% of nonprofit employees earn below the ALICE threshold and struggle financially,2 making efficient benefits administration crucial for both employee wellbeing and organizational sustainability.

    Key Takeaways

    • Nonprofit HR teams can lose an estimated 200 to 400 hours annually to broker enrollment errors and manual corrections
    • Benefits administration costs average $24 per employee per month with disconnected systems and high error rates
    • The Administrative Burden Audit helps nonprofits quantify hidden costs and identify improvement opportunities
    • Professional Employer Organizations can reduce administrative costs by $450 per employee annually
    • 53% of nonprofits are expanding in 2025, making efficient benefits administration increasingly critical

    The Hidden Cost of Benefits Administration Errors

    Most nonprofit leaders focus on visible costs like premium increases or new benefit additions. However, the administrative burden of managing benefits errors often represents a larger drain on organizational resources than the benefits themselves. Industry research shows that benefits administration costs average $24 per employee per month when using disconnected systems, with error rates significantly higher during open enrollment periods.3

    These errors manifest in multiple ways that compound over time. Enrollment mistakes require hours of detective work to identify and correct. Former employees remaining active on plans create ongoing premium charges that may go unnoticed for months. Dependent eligibility errors can trigger compliance issues or expensive retroactive corrections. Each error generates a cascade of administrative work that pulls staff away from mission-focused activities.

    Common Broker Error Patterns

    Through extensive work with nonprofit organizations, certain patterns emerge repeatedly:

    • Data entry mistakes: Misspelled names, incorrect birthdates, and transposed Social Security numbers that delay coverage activation
    • Dependent enrollment errors: Missing spouse or child additions, incorrect effective dates, and eligibility verification failures
    • Termination processing delays: Former employees remaining active on plans for weeks or months after departure
    • Plan selection mistakes: Employees enrolled in wrong coverage levels or benefit options despite clear election forms
    • Billing discrepancies: Charges for terminated employees, incorrect premium calculations, and missing discounts or credits

    The National Association of Professional Employer Organizations research indicates that companies using professional services can reduce HR administrative costs by approximately $450 per employee annually,4 largely by eliminating these types of recurring errors and the administrative burden they create.

    Introducing The Administrative Burden Audit

    To help nonprofits quantify the true cost of benefits administration inefficiencies, we developed The Administrative Burden Audit, a systematic framework for measuring hidden costs and identifying improvement opportunities. This audit examines six key areas where broker errors typically drain nonprofit resources:

    Time Tracking Assessment

    The first component measures actual staff hours spent on benefits-related administrative tasks. Most nonprofits dramatically underestimate this burden because the work happens in small increments throughout the year rather than concentrated blocks.

    Weekly Time Categories:

    • Enrollment error corrections and follow-up communications
    • Billing discrepancy investigations and resolution
    • Employee questions about coverage or claim issues
    • Vendor communication and status updates
    • Manual data entry and verification processes

    A dual-organization HR administrator typically spends 8 to 12 hours weekly on these activities during active periods and 4 to 6 hours during maintenance periods, totaling 300 to 450 hours annually. At a loaded cost of $35 to $50 per hour for HR staff time, this represents $10,500 to $22,500 in annual administrative costs before considering benefits.

    Error Frequency Analysis

    The second component tracks specific error types and their resolution time. Organizations with inefficient brokers typically experience an estimated 12 to 24 enrollment errors per year per 100 employees, with each error requiring 2 to 8 hours to resolve depending on complexity.

    High-performing benefits administration systems, including those offered through PEO health coverage solutions, typically reduce error rates to 2 to 4 per year per 100 employees while providing dedicated support to resolve issues quickly.

    The True Cost of Manual Processes

    Beyond error correction, manual benefits administration creates ongoing inefficiencies that compound over time. Open enrollment becomes a months-long ordeal of paper forms, data entry, and verification rather than a streamlined digital process.

    SHRM research shows that benefits offerings have increased 23% in recent years, from 175 available options to 216 different benefit types.5 This expansion creates additional complexity for nonprofits managing benefits manually, as each new option requires separate enrollment tracking, vendor coordination, and ongoing administration.

    Scalability Challenges

    Robert Half research indicates that 53% of nonprofit employers are expanding their teams in 2025.6 Growing organizations quickly discover that manual benefits processes do not scale efficiently. Adding new employees becomes increasingly complex as benefit options multiply and compliance requirements expand.

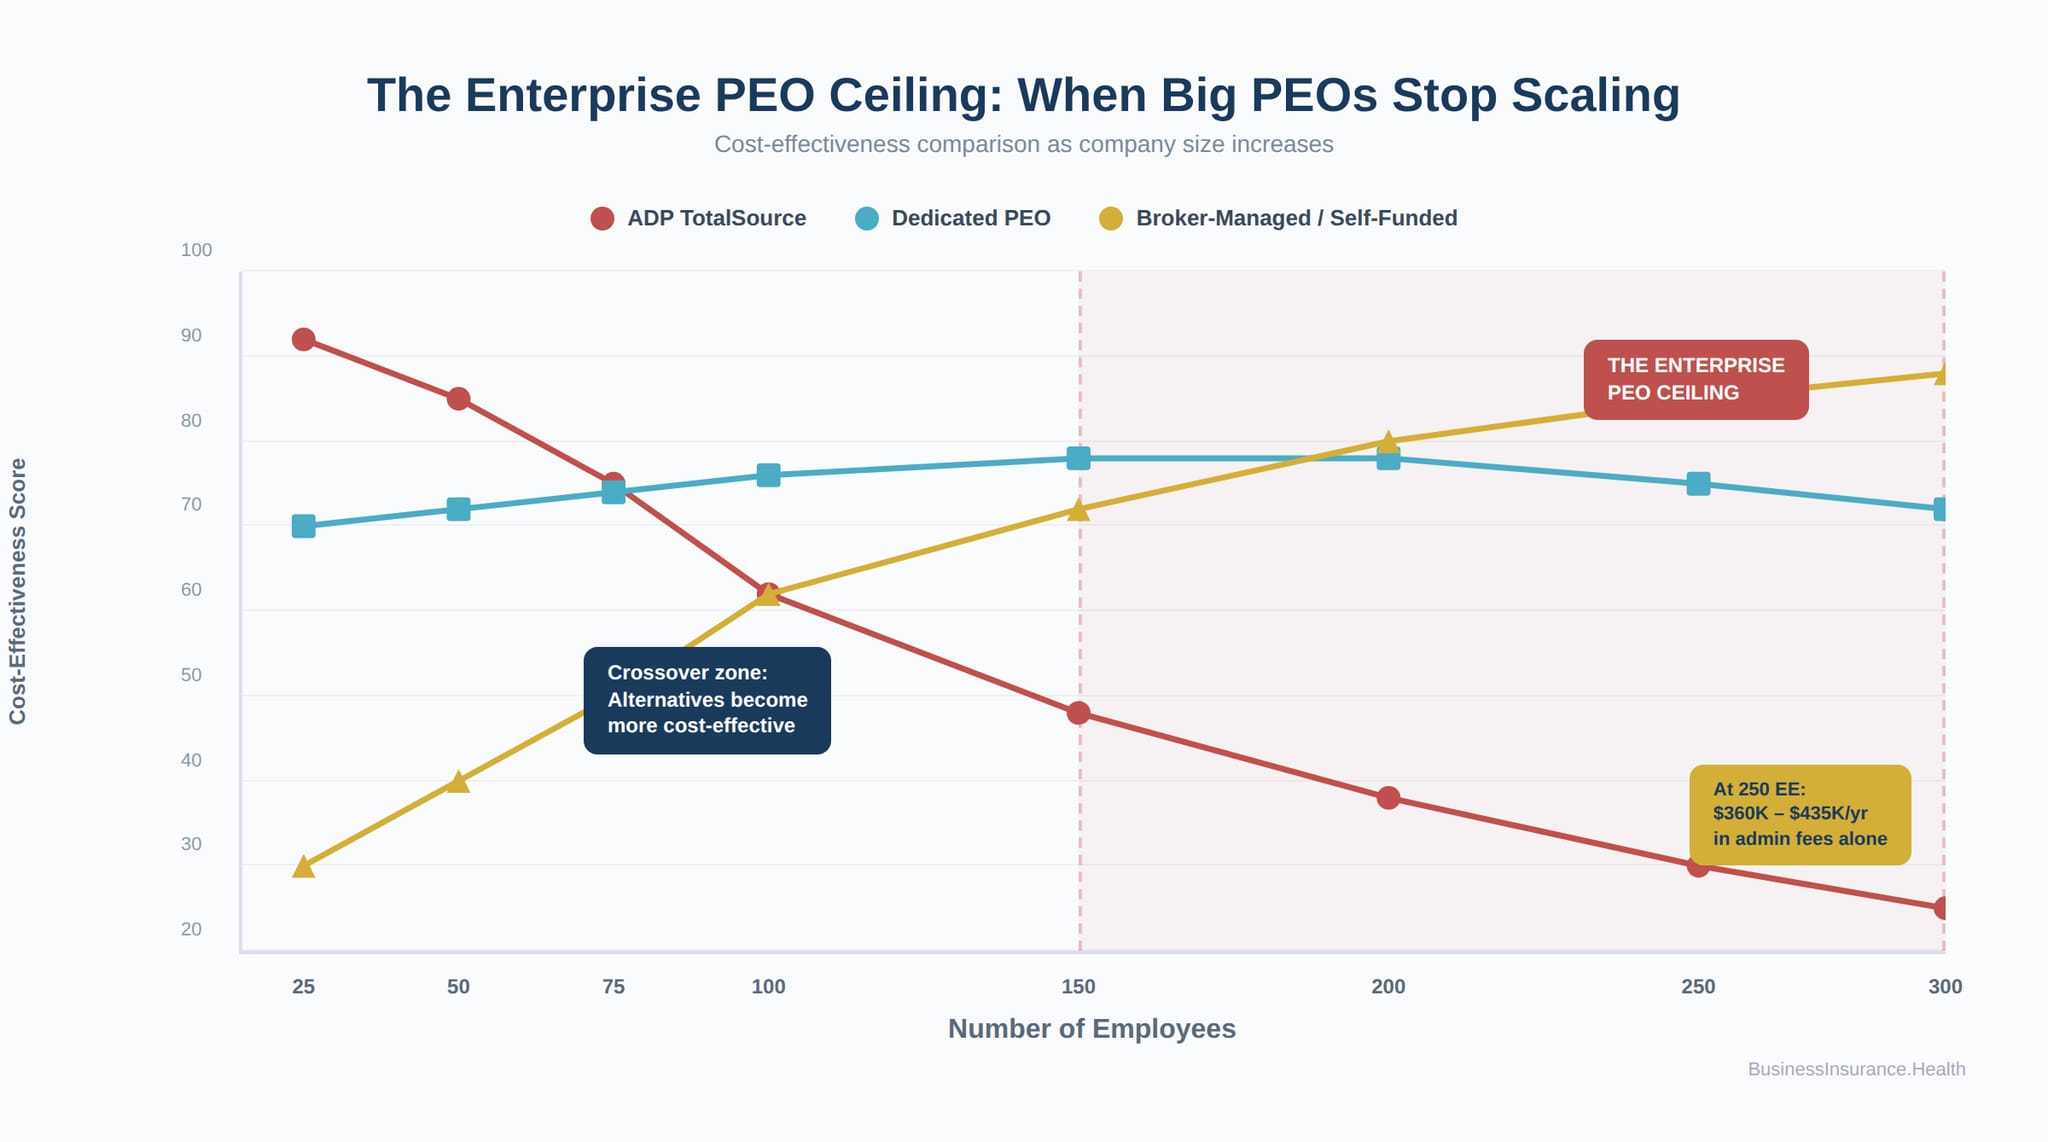
    Organizations that rely on manual processes often reach a tipping point around 40 to 60 employees where the administrative burden becomes overwhelming. This is precisely when many nonprofits begin exploring comprehensive employee benefits solutions that provide both cost savings and administrative relief.

    Financial Impact Beyond Administration

    While administrative costs represent the most visible burden, broker errors create additional financial impacts that many nonprofits overlook:

    Premium Leakage

    Terminated employees remaining on active status create direct premium charges that can persist for months. A terminated employee with family coverage costing $1,500 monthly represents $18,000 in annual premium leakage if not caught quickly. Across an 80-employee organization, just 2-3 such errors annually can cost $5,000 to $10,000 in unnecessary premiums.

    Compliance Risk

    Benefits enrollment errors can trigger compliance violations that carry financial penalties. Incorrect dependent eligibility, missed COBRA notifications, or improper plan changes can result in Department of Labor fines ranging from $1,000 to $10,000 per violation. For cash-strapped nonprofits, these penalties represent a significant unbudgeted expense.

    Employee Relations Impact

    Independent Sector research shows that 40% of nonprofits say their employee benefits positively impact workforce recruiting and retention, while 25% report that insufficient benefits negatively affect their ability to attract and retain staff.7 Benefits administration errors undermine these positive impacts by creating employee frustration and distrust.

    When employees experience coverage gaps, billing issues, or claim denials due to enrollment errors, they lose confidence in the organization’s ability to provide reliable benefits. This erosion of trust can contribute to turnover, which costs nonprofits an estimated 50% to 200% of an employee’s annual salary in replacement costs.

    Technology Solutions and Automation

    Modern benefits administration technology addresses many common error sources through automation and integrated data systems. However, not all technology solutions provide equal value for nonprofit organizations.

    Automated systems can handle repetitive tasks with precision and efficiency, reducing the burden on HR staff and minimizing the risk of errors.8 Key features that provide the greatest impact for nonprofits include:

    • Real-time enrollment validation that catches errors before submission
    • Integrated payroll deduction calculations that eliminate manual data entry
    • Automated termination processing that removes employees from all benefits simultaneously
    • Electronic forms and signatures that reduce processing time and improve accuracy
    • Centralized employee data that eliminates duplicate entry across multiple systems

    Organizations considering technology upgrades should evaluate solutions based on total cost reduction rather than just software pricing. A system that costs $15 per employee monthly but eliminates 200 hours of administrative work provides significantly more value than a $5 per employee solution that only addresses basic enrollment.

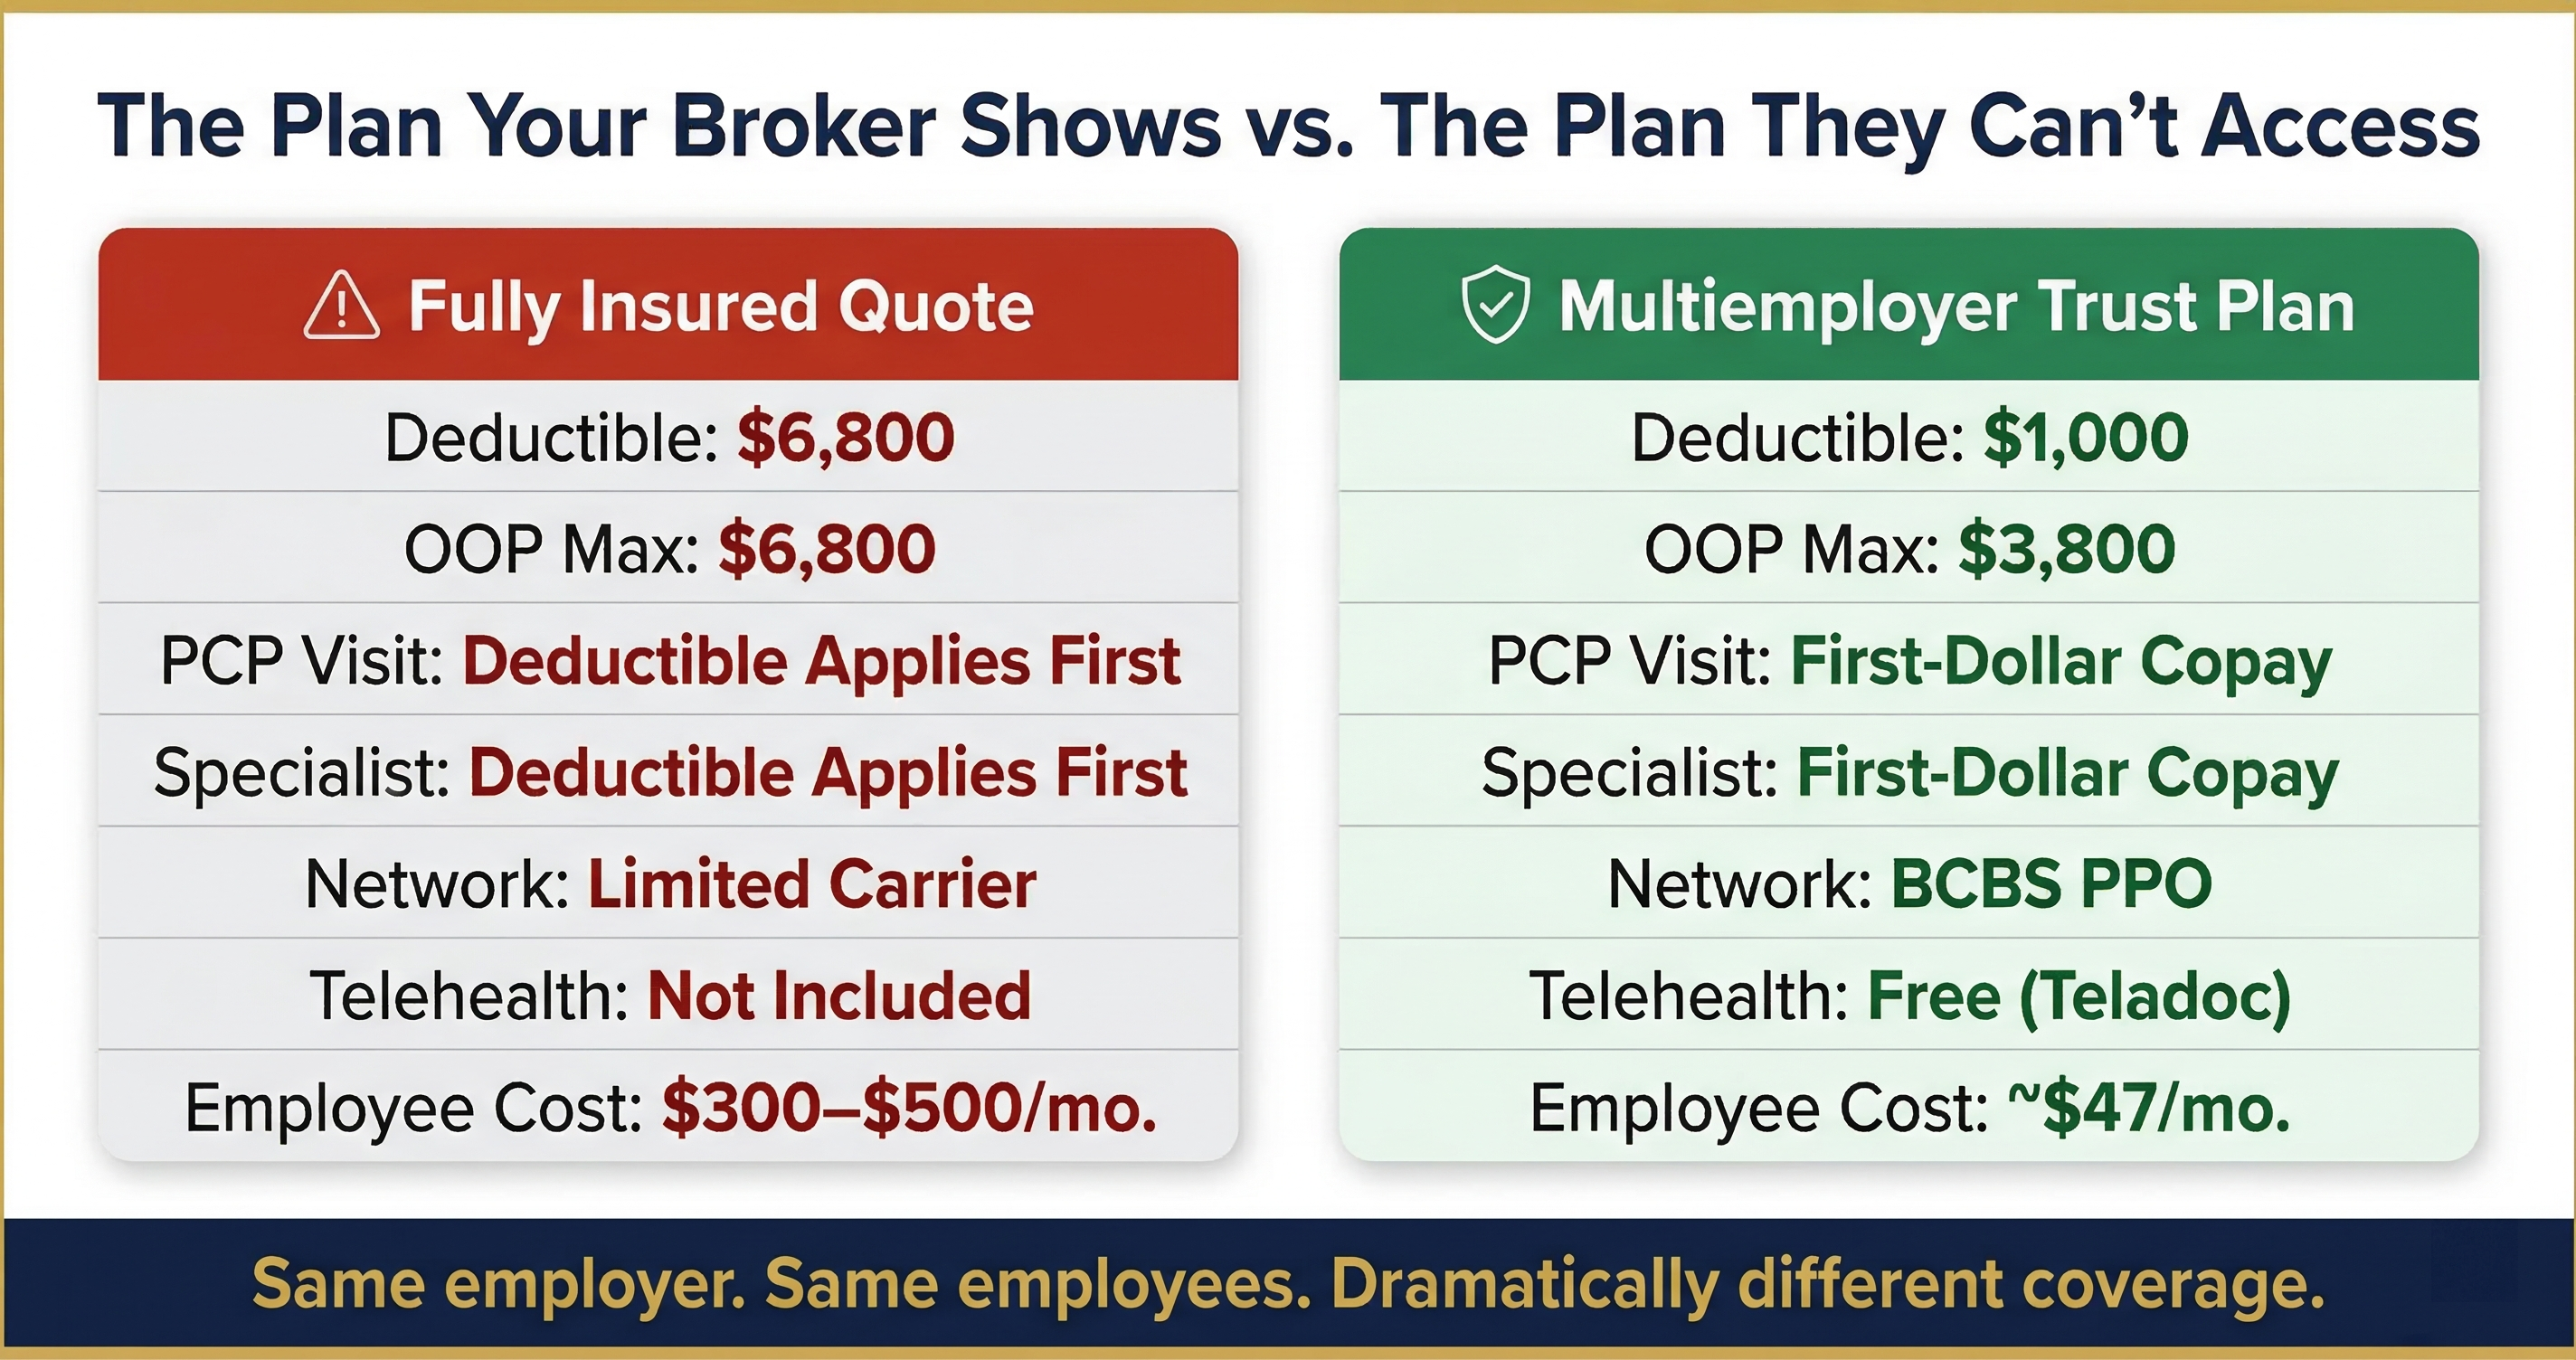
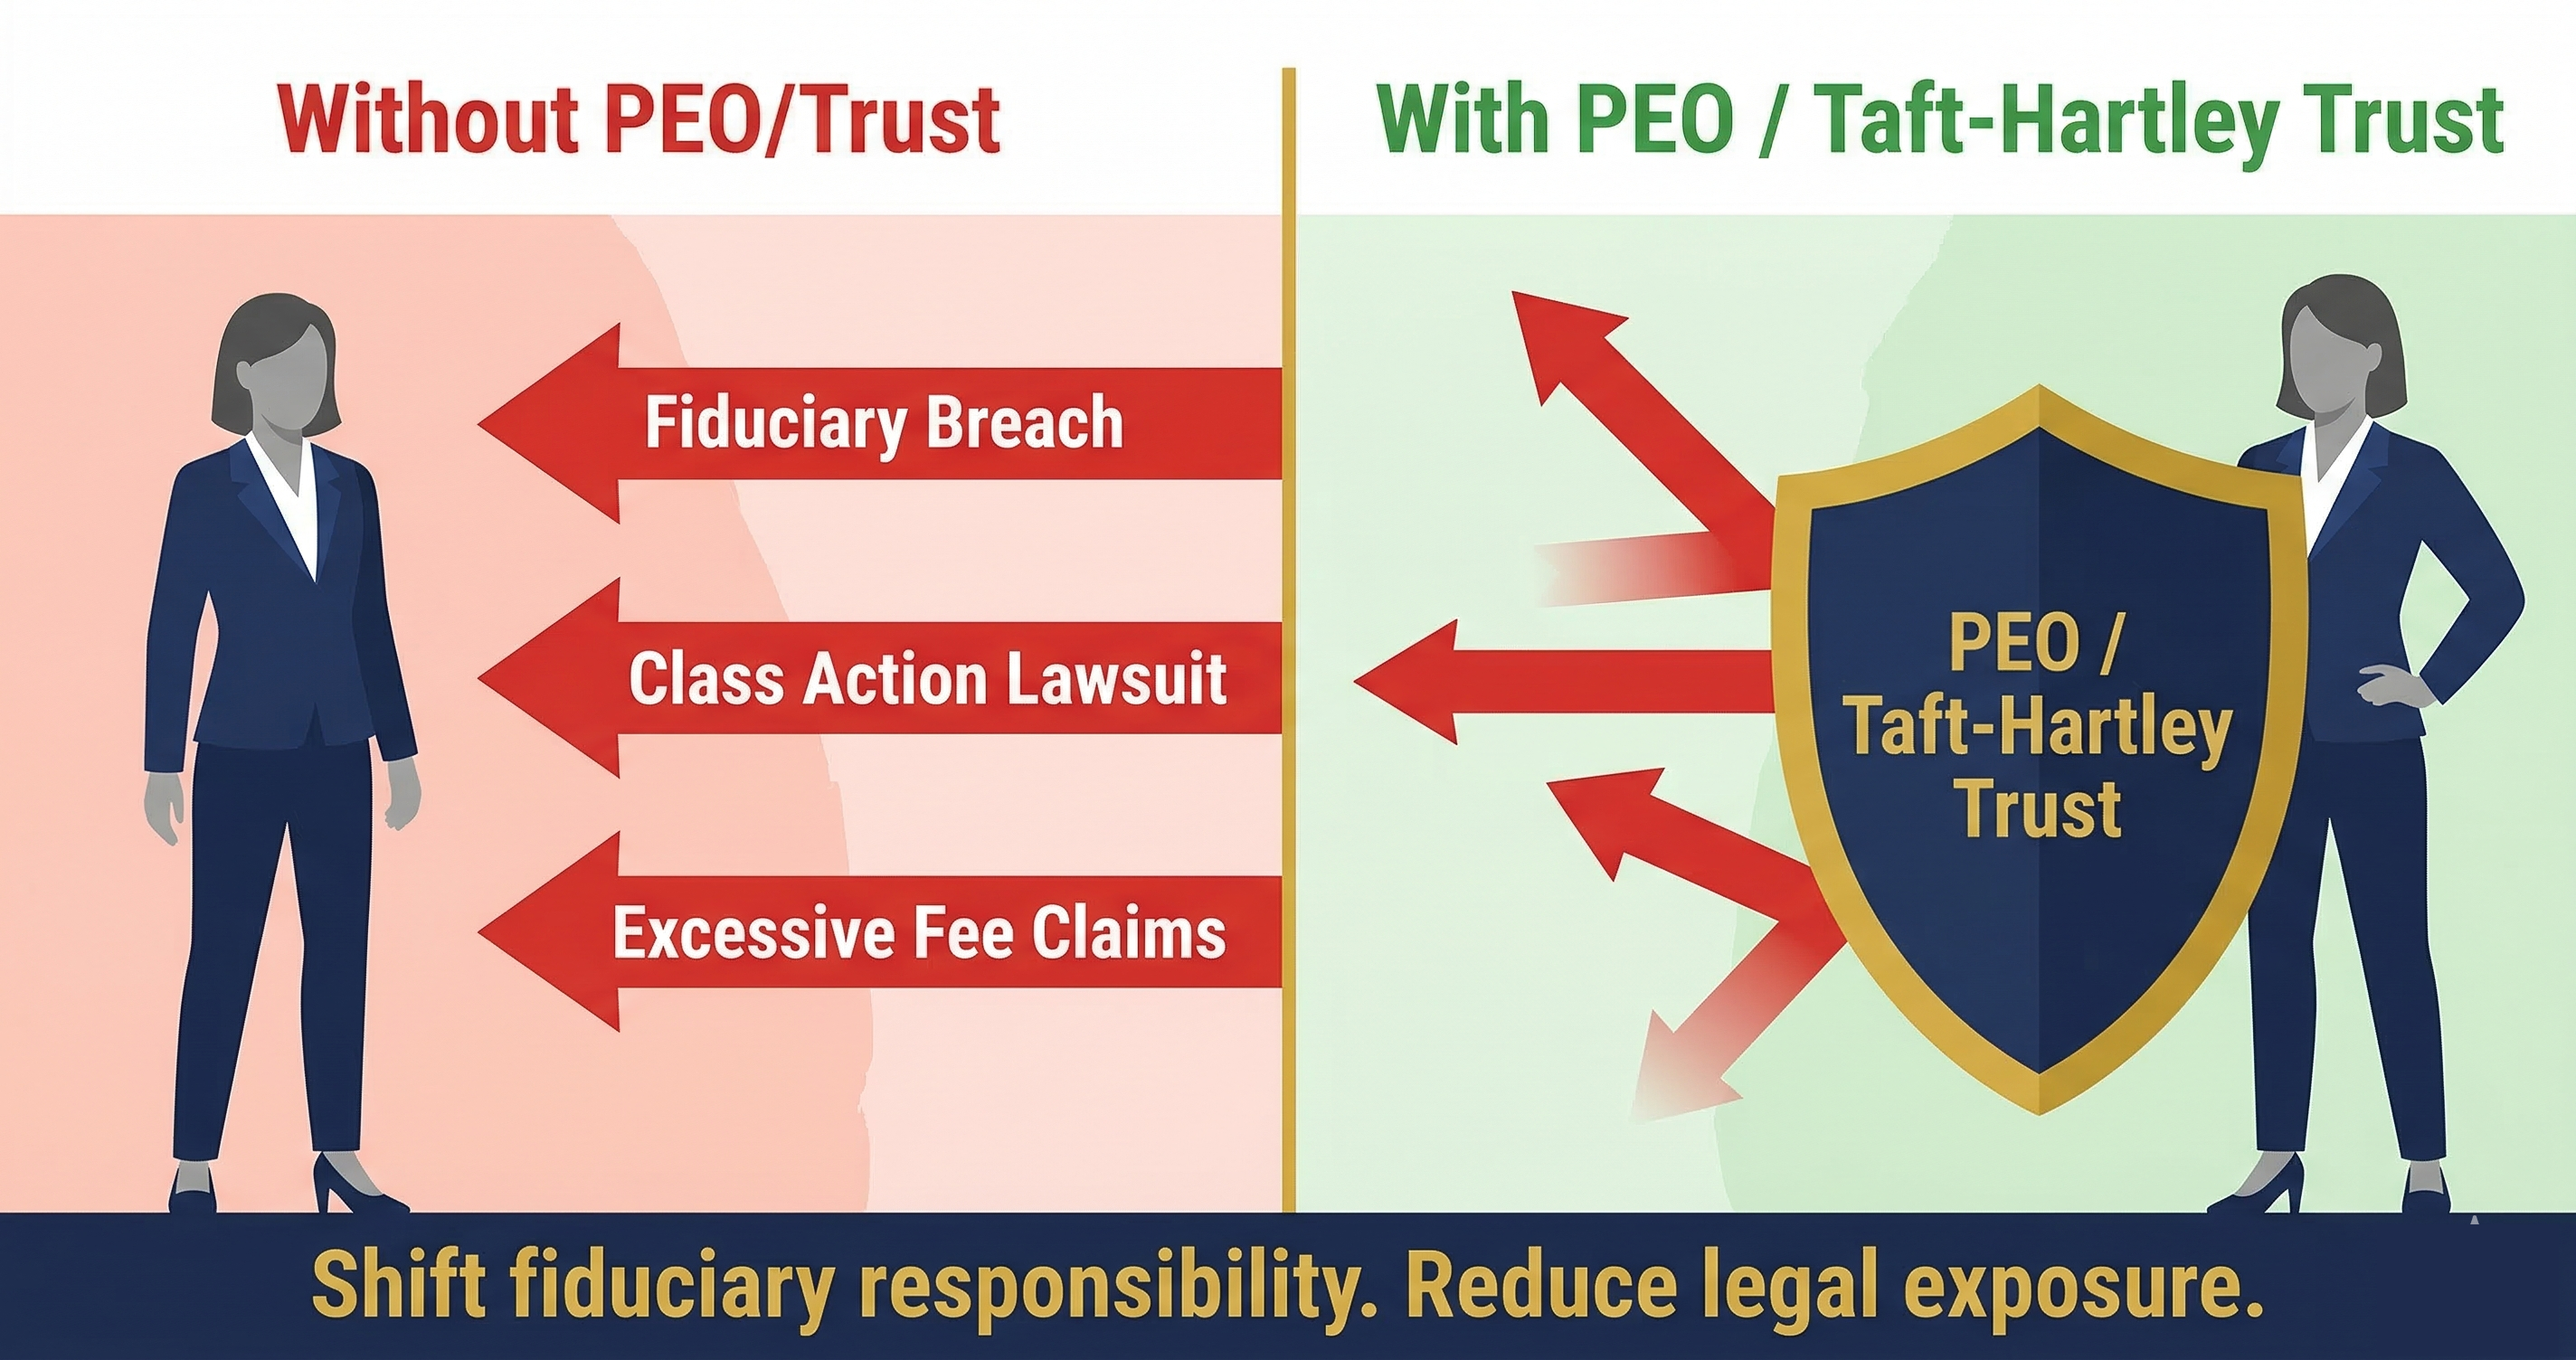
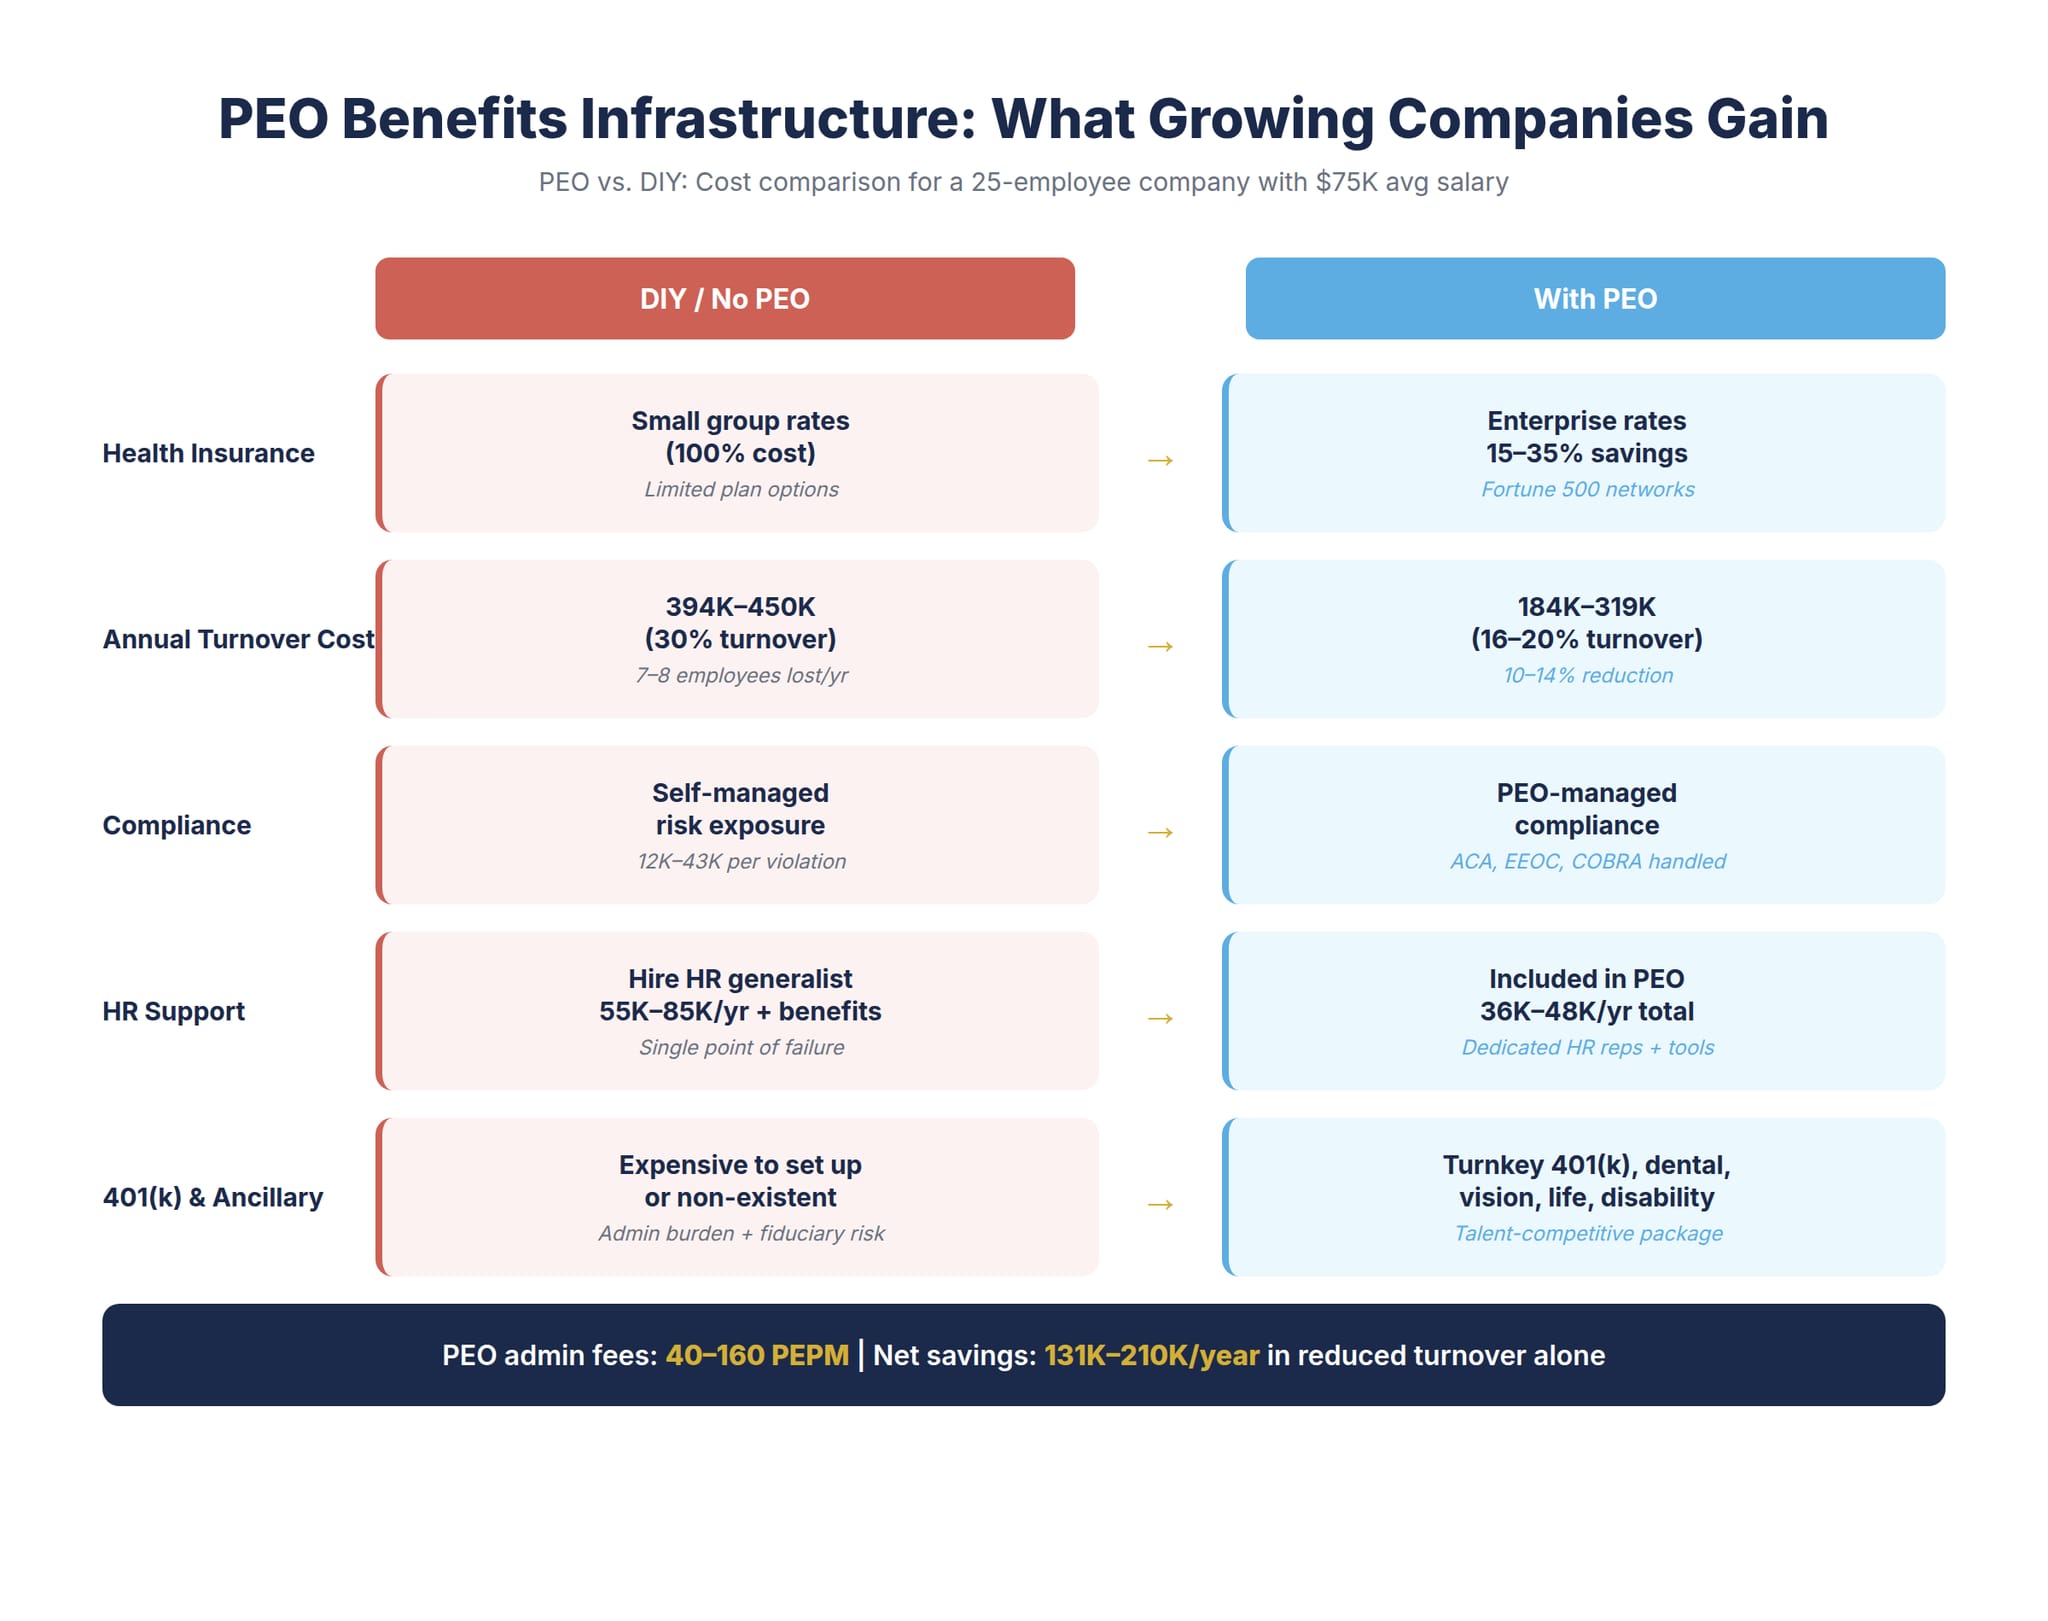
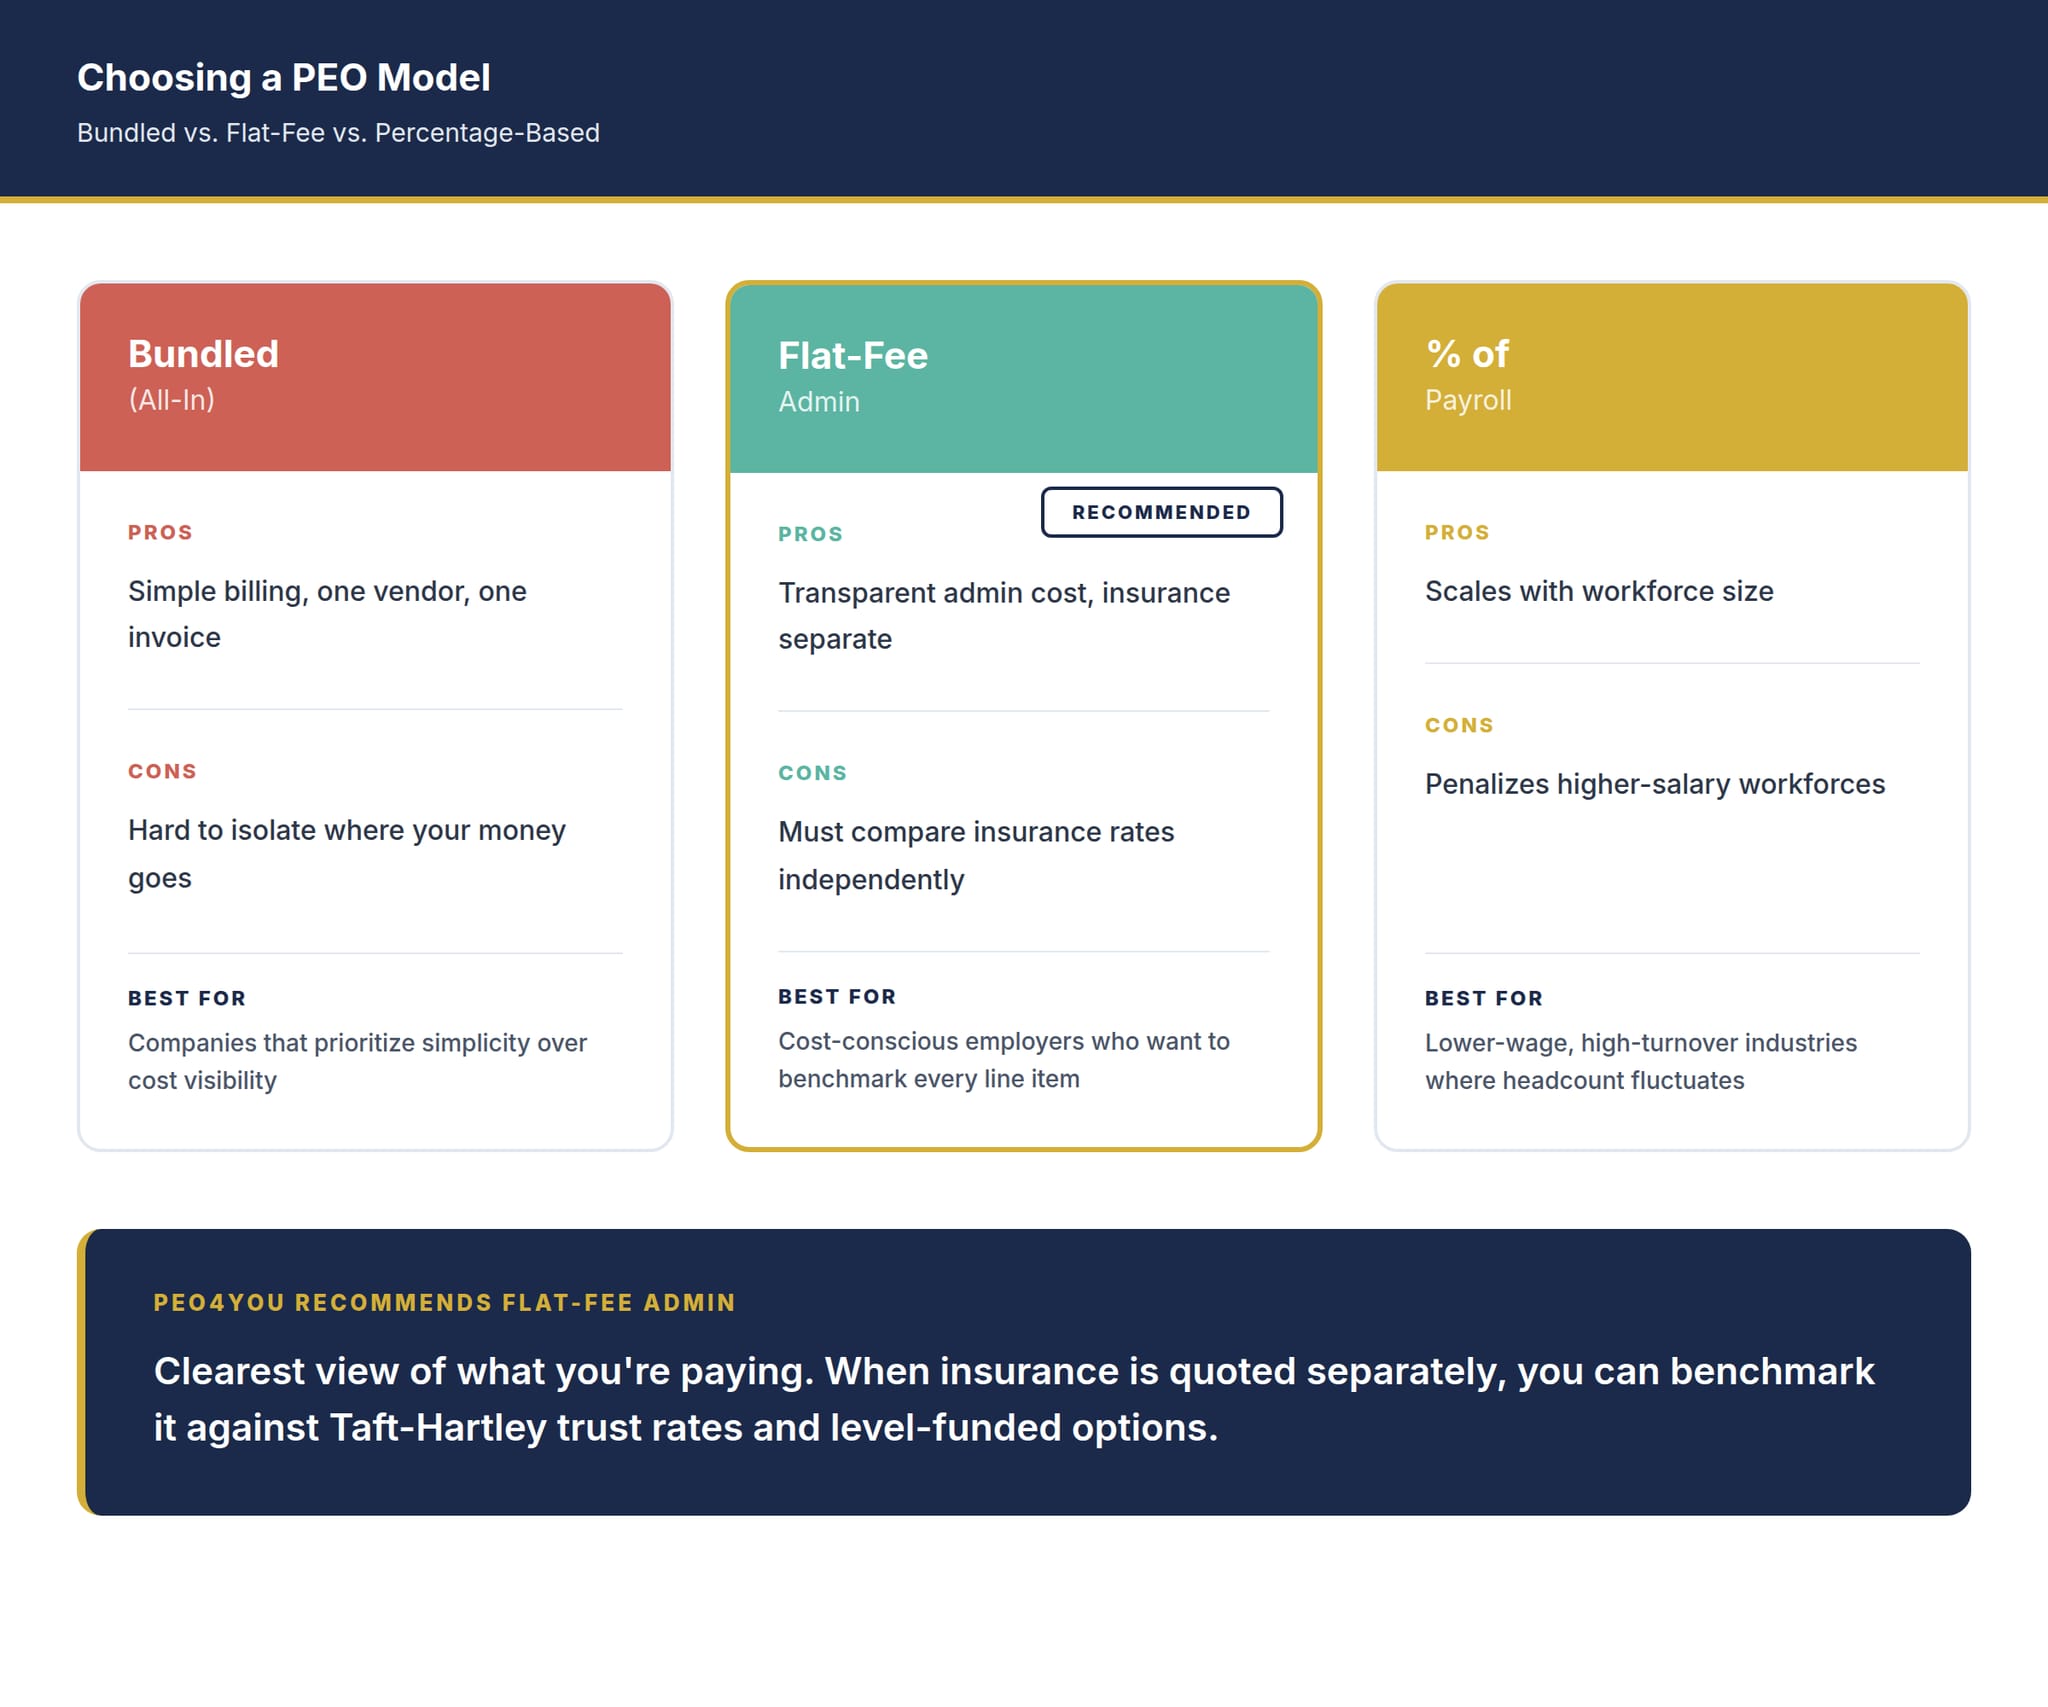
    Professional Employer Organization Benefits

    For many nonprofits, partnering with a Professional Employer Organization represents the most comprehensive solution to benefits administration challenges. PEOs provide access to Fortune 500-level benefits packages while handling all administrative functions through dedicated support teams.

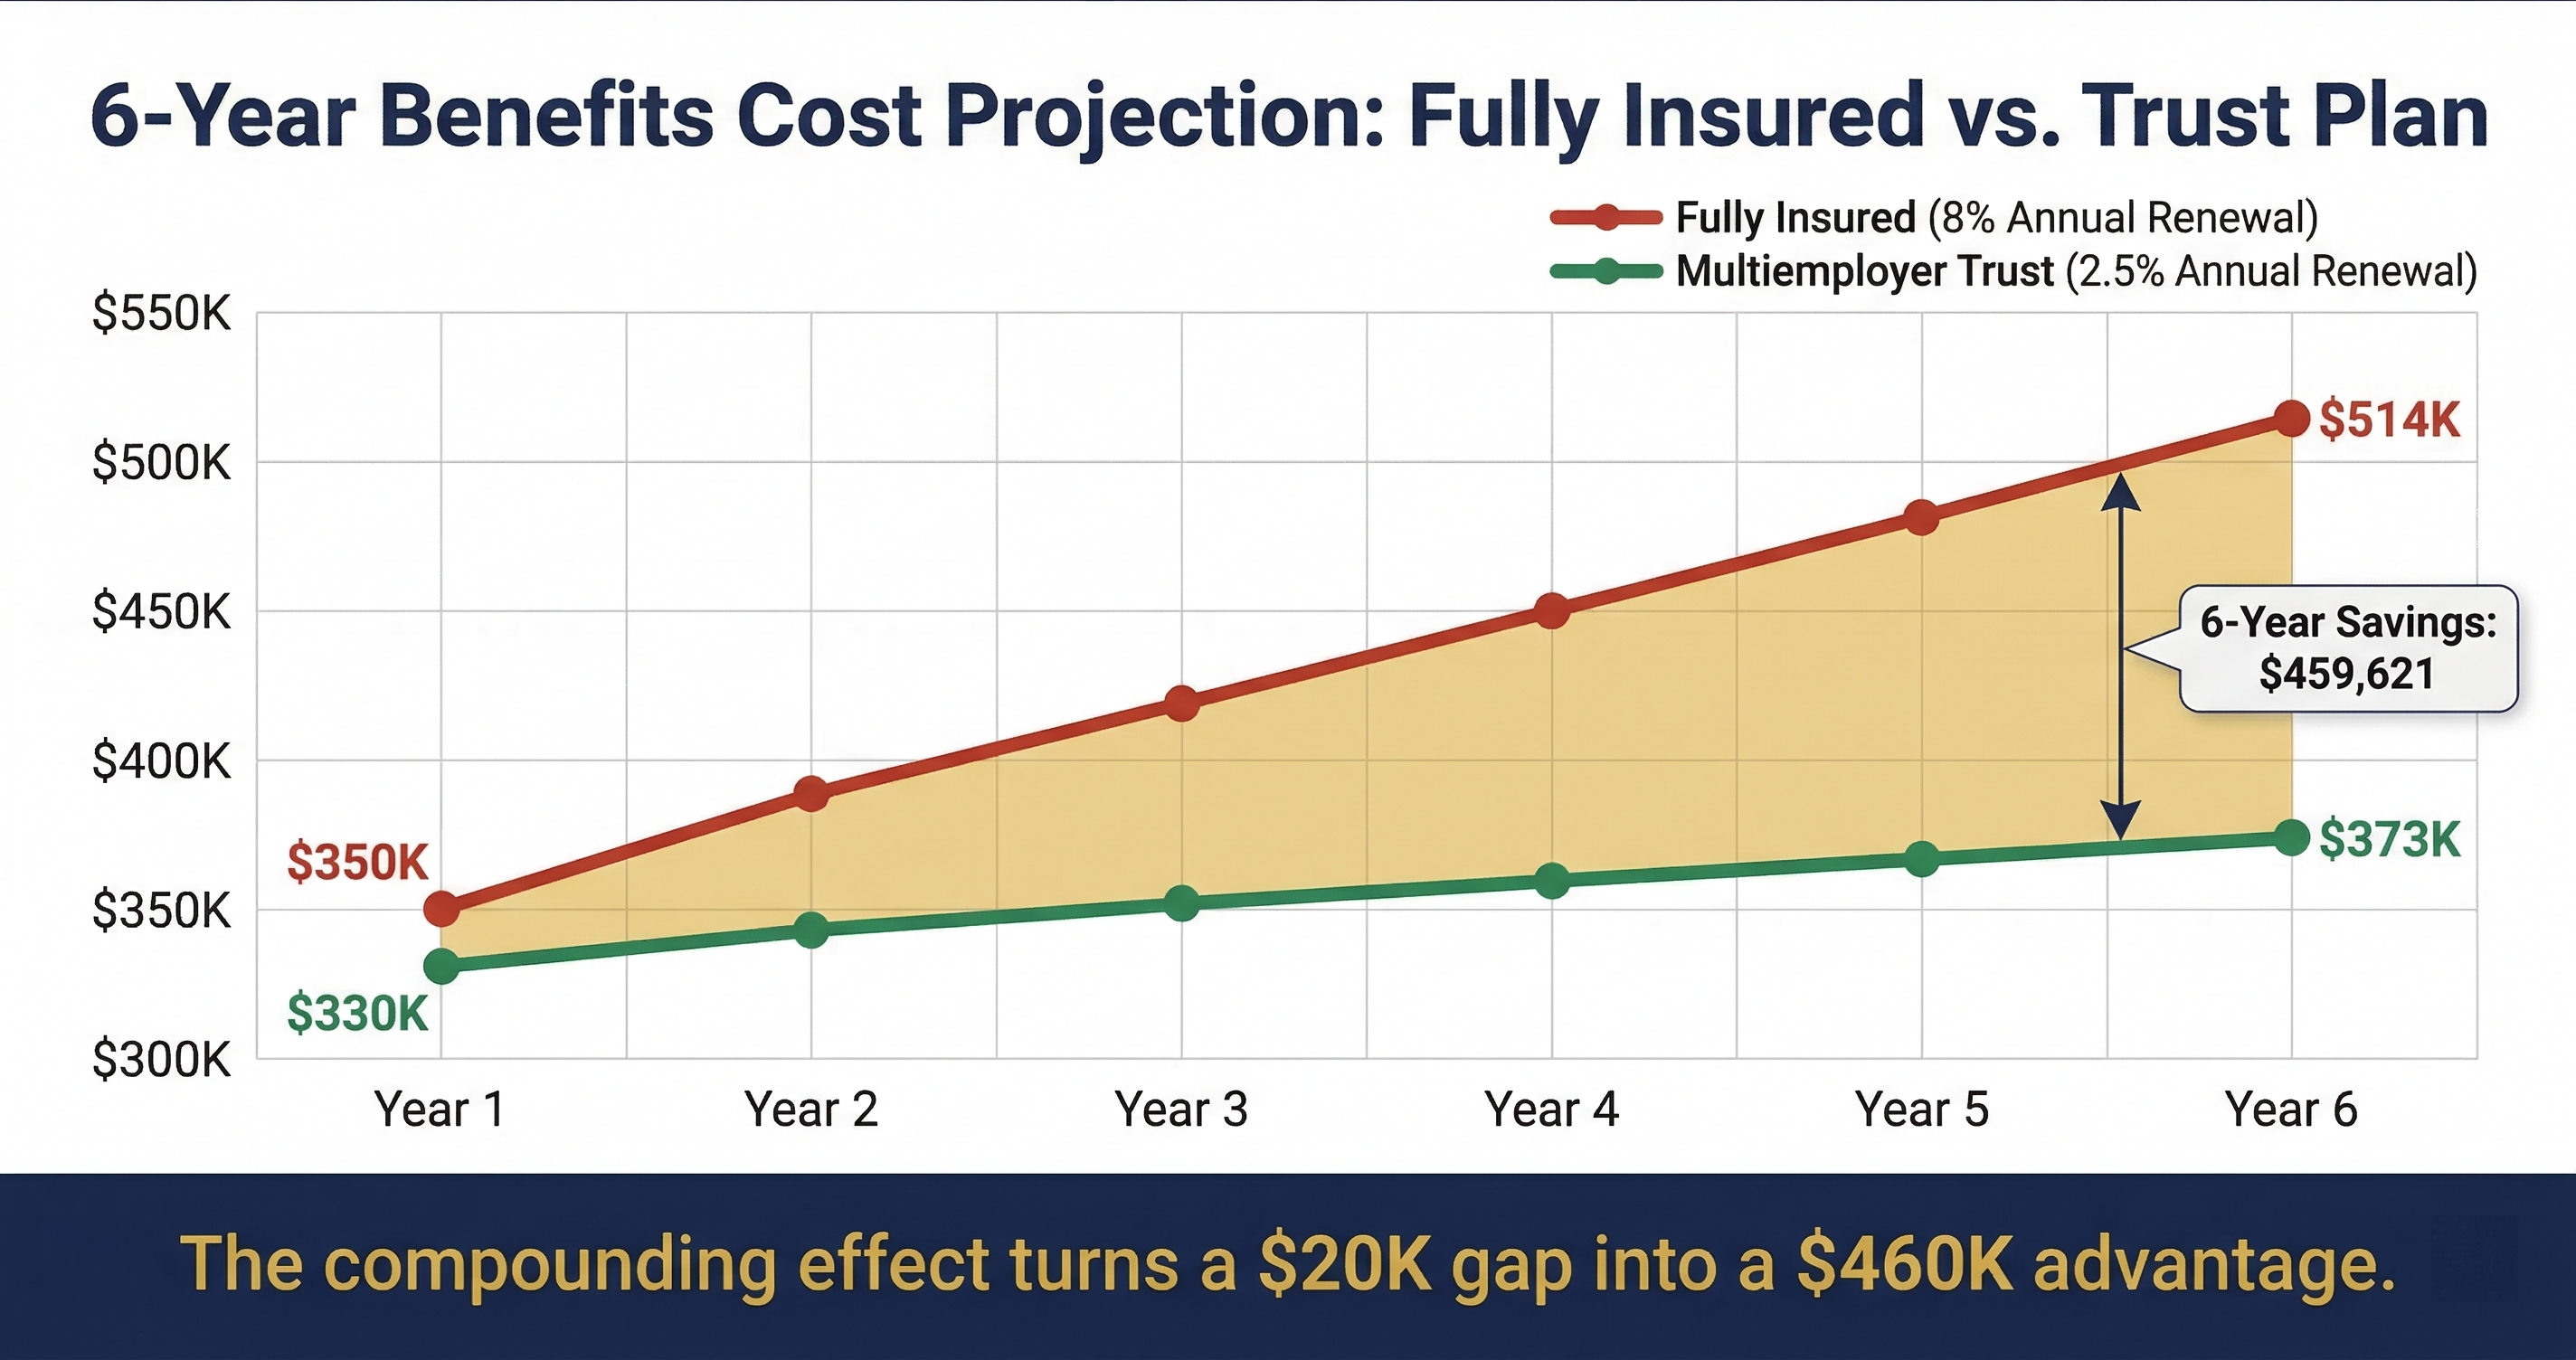
    NAPEO research demonstrates that companies using PEOs experience a 27.2% annual return on investment,9 largely driven by reduced administrative costs and improved operational efficiency. For nonprofits, this translates to more resources available for mission-critical activities.

    Comprehensive Support Model

    Unlike traditional brokers who primarily focus on plan selection and renewal, PEOs provide year-round administrative support including:

    • Dedicated account management with nonprofit sector expertise
    • Real-time enrollment processing and error prevention
    • Integrated payroll and benefits administration
    • Employee self-service portals that reduce HR inquiries
    • Compliance monitoring and automatic updates for regulatory changes

    For organizations concerned about nonprofit health coverage costs, PEOs often provide access to larger risk pools and better rates than organizations can obtain independently, particularly for smaller nonprofits with fewer than 100 employees.

    Benefits ROI Calculator

    See how your nonprofit’s benefits spending compares. Quantify the return on 42 different benefit types using 9 institutional data sources.

    No login required. No email gate. Free.

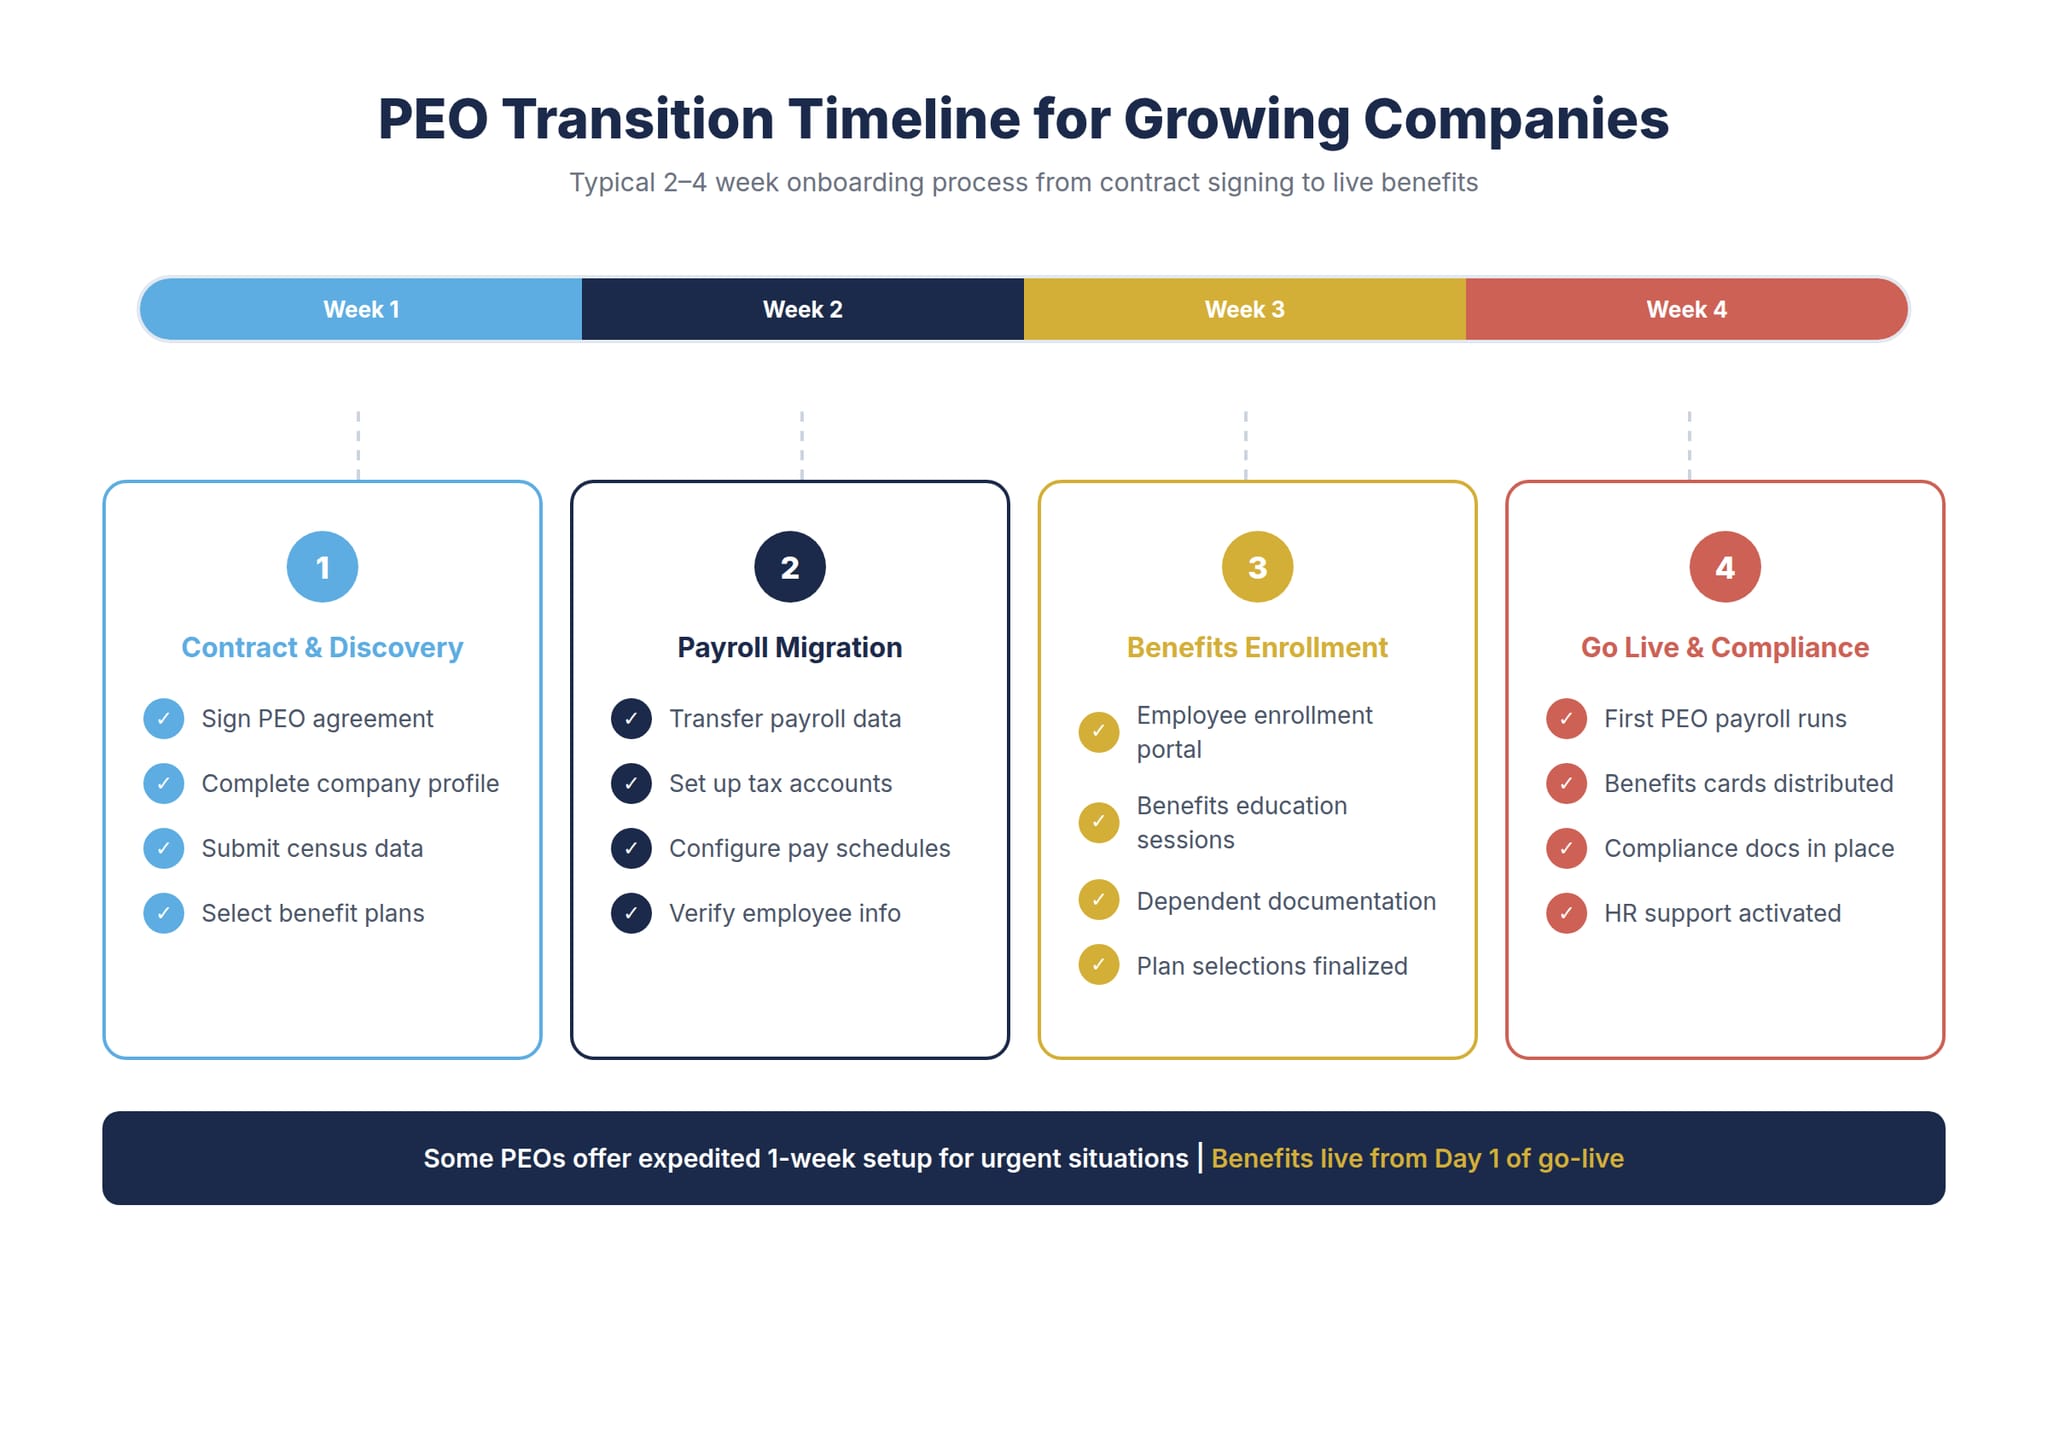
    Implementation Strategy for Nonprofits

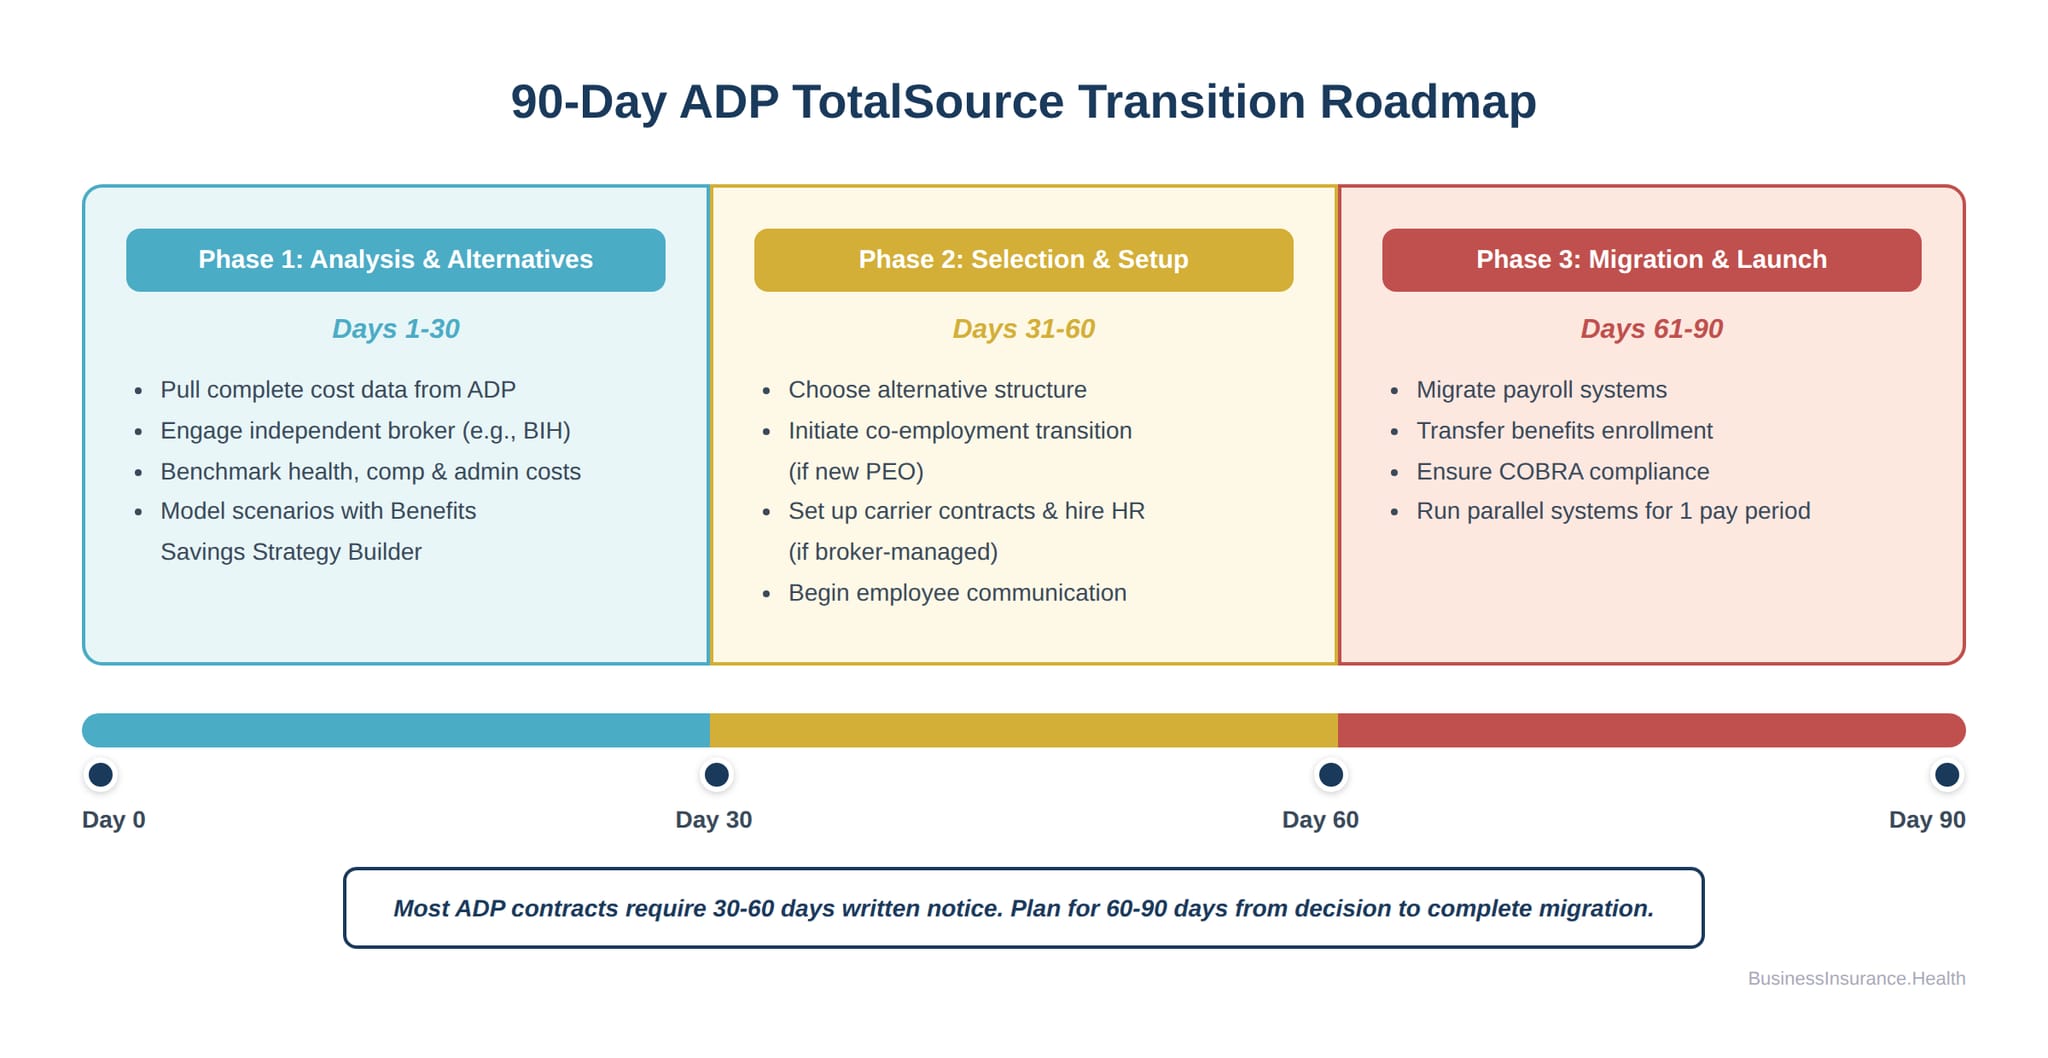
    Transitioning from inefficient benefits administration to streamlined processes requires careful planning and realistic timeline expectations. Most nonprofits can complete this transition within 90 to 120 days with proper preparation.

    Assessment Phase

    Begin with a comprehensive Administrative Burden Audit to establish baseline metrics. Document current processes, error rates, and time investments to create a clear picture of improvement opportunities. This data becomes essential for evaluating potential solutions and measuring success post-implementation.

    Key Assessment Questions:

    • How many hours does your team spend weekly on benefits administration?
    • What types of errors occur most frequently with your current broker?
    • How long does it typically take to resolve enrollment or billing issues?
    • Are there former employees still appearing on benefit invoices?
    • How satisfied are employees with current benefits communication and support?

    Vendor Evaluation Criteria

    When evaluating potential benefits administration partners, nonprofits should prioritize service quality and error prevention over purely cost considerations. The cheapest option often creates the highest long-term costs through administrative burden and mistakes.

    Look for providers that demonstrate:

    • Specific experience serving nonprofit organizations
    • Dedicated account management and customer service teams
    • Technology platforms designed to prevent common enrollment errors
    • Transparent reporting on error rates and resolution times
    • Integration capabilities with existing payroll and HR systems

    Measuring Success and ROI

    Successful benefits administration improvements should deliver measurable results within the first enrollment period. Track key performance indicators to validate that changes are delivering expected value.

    Primary Success Metrics

    • Administrative time reduction: Target 50% to 70% reduction in HR hours spent on benefits tasks
    • Error rate improvement: Aim for fewer than 5 enrollment errors annually per 100 employees
    • Issue resolution speed: Most problems should resolve within 24 to 48 hours rather than weeks
    • Employee satisfaction: Track improvements in benefits-related employee survey scores
    • Cost per employee: Total benefits administration costs should decrease despite service improvements

    Organizations that implement comprehensive solutions typically see administrative time reductions of 300 to 400 hours annually, equivalent to $10,500 to $20,000 in staff cost savings. Combined with reduced errors and improved employee satisfaction, these improvements often deliver 200% to 300% return on investment within the first year.

    Future-Proofing Nonprofit Benefits

    As the nonprofit sector continues evolving, benefits administration must adapt to changing workforce expectations and regulatory requirements. Organizations that invest in scalable solutions today position themselves for sustainable growth tomorrow.

    Emerging trends affecting nonprofit benefits administration include:

    • Increased demand for flexible and voluntary benefit options
    • Growing emphasis on mental health and wellness programs
    • Remote work considerations affecting coverage and administration
    • Enhanced compliance requirements and reporting obligations
    • Integration expectations with other HR technology platforms

    By addressing current administrative inefficiencies while selecting solutions that accommodate future growth, nonprofits can ensure that benefits management supports rather than hinders their mission-focused work.

    For organizations ready to explore comprehensive benefits solutions, resources are available to compare small business health coverage options and evaluate total cost of ownership rather than just premium expenses.

    Frequently Asked Questions

    Q: How long does it typically take to fix benefits enrollment errors?

    A: Simple errors like name corrections may resolve in 24 to 48 hours, while complex issues involving dependent eligibility or plan changes can take 1 to 3 weeks. Organizations with professional administration support typically resolve most issues within 1 to 2 business days.

    Q: What should nonprofits budget for benefits administration costs?

    A: Industry benchmarks suggest $15 to $30 per employee per month for comprehensive benefits administration. However, total cost should include internal HR time, which often represents the largest expense component.

    Q: Can small nonprofits with fewer than 50 employees benefit from professional administration?

    A: Yes, smaller organizations often see the greatest proportional benefit since they typically lack dedicated HR staff to handle complex benefits administration. Professional services can provide expertise and efficiency that smaller organizations cannot develop internally.

    Q: How do nonprofits measure the ROI of improved benefits administration?

    A: Track time savings, error reduction, and employee satisfaction improvements. Most organizations see 200% to 300% ROI within 12 months through reduced administrative burden and fewer costly mistakes.

    Q: What happens during the transition to a new benefits administration system?

    A: Professional transitions typically take 60 to 90 days and include data migration, employee communication, training, and parallel processing to ensure no coverage gaps occur. Experienced providers handle most transition complexity.

    References

    1. U.S. Bureau of Labor Statistics. “Nonprofit Sector Research Data.” BLS, 2025. bls.gov/bdm/nonprofits
    2. Social Current. “Navigating Workforce Challenges: 2025 Trends and Solutions for the Social Sector.” Social Current, February 2025. social-current.org
    3. Lift HCM. “The Hidden Costs of Using Multiple HR, Payroll, and Benefits Systems.” Lift HCM, August 2025. lifthcm.com
    4. Axcet HR Solutions. “PEO Cost Considerations: Is It Worth the Investment?” Axcet HR, October 2025. blog.axcethr.com
    5. SHRM. “Employee Benefit Trends for 2025.” SHRM, August 2025. shrm.org
    6. Robert Half. “Employment Trends Spotlight: Nonprofit Industry.” Robert Half, June 2025. roberthalf.com
    7. Independent Sector. “New Report Shows Nonprofits Are Being Squeezed by Growing Community Need and Fewer Resources.” Independent Sector, December 2025. independentsector.org
    8. Navia Benefit Solutions. “6 Common Challenges in Benefit Administration Services & How to Overcome Them.” Navia Benefits, December 2025. naviabenefits.com
    9. NAPEO. “The ROI of Using a PEO.” National Association of Professional Employer Organizations, March 2025. napeo.org

    About the Author

    Sam Newland, CFP®, is the founder of Business Insurance Health (BIH). With over 13 years of experience in employee benefits and a background as the former #1 face-to-face health coverage agent nationally, Sam helps employers with 30-200+ employees navigate complex funding strategies including PEO, self-funded, captive, level-funded, and Taft-Hartley arrangements. Contact: [email protected] | 857-255-9394

    This article is educational and does not constitute professional financial, legal, or benefits advice. Nonprofit organizations should consult with qualified benefits consultants and legal counsel to evaluate strategies appropriate for their specific size, state, and workforce.

  • Trade Contractor Employee Benefits: What to Do When Your Broker Fails You

    Trade Contractor Employee Benefits: What to Do When Your Broker Fails You

    When a mid-Atlantic mechanical contractor reached their annual enrollment period, they faced a familiar problem: their benefits broker had stopped returning calls. Despite paying over $5,200 monthly for just four enrolled employees, the business owner found herself managing benefits crises alone, from out-of-network coverage gaps to claim disputes that should have been routine.

    This scenario plays out across thousands of trade contracting businesses every year. The combination of industry-specific risks, complex regulatory requirements, and often inadequate broker support creates a perfect storm of benefits challenges that can consume valuable time and resources.

    Trade contractors face unique obstacles in the benefits landscape. Unlike office-based businesses, contractors must navigate workers’ compensation complexities, multi-state compliance issues, and the reality that their workforce often includes both employees and independent contractors with vastly different coverage needs.

    Key Takeaways

    • The Broker Responsiveness Test: a framework to evaluate whether your benefits broker is actually serving your business
    • Trade contractors pay 15-25% more for comparable health coverage due to industry risk factors1
    • Unresponsive brokers can cost businesses an estimated $8,000-$15,000 annually in missed savings opportunities and lost productivity2
    • PEO arrangements can reduce benefits administration costs by 20-40% for companies with 5-50 employees3
    • Fewer than half of construction workers (49.1%) have employer-provided health coverage, the lowest of any major industry4
    • Network adequacy issues are a growing concern for small business health plans, particularly in specialized trades where provider options may be limited5

    Why Trade Contractors Get Stuck with Poor Benefits Support

    The construction industry represents roughly 5% of the total U.S. workforce, but accounts for a disproportionate share of workplace fatalities, with over 1,000 deaths annually6. This risk profile makes trade contractors less attractive to many traditional benefits brokers, who often prefer the simpler, more predictable world of office-based businesses.

    When brokers do work with construction companies, they frequently treat them as secondary priorities. The result? Delayed responses, limited plan options, and a persistent feeling that your business doesn’t matter to your benefits provider.

    The Hidden Costs of Broker Neglect

    Poor broker service creates measurable financial impact beyond just premium costs. A recent analysis of small business benefits administration found that companies with inadequate broker support can spend 10-20 additional hours per month handling benefits issues internally7. At typical contractor billing rates of $45-$85 per hour, this can translate to thousands in lost productivity annually.

    More critically, broker neglect often leads to coverage gaps that become expensive problems:

    • Network adequacy issues: When your broker doesn’t properly vet provider networks, workers face unexpected out-of-network costs
    • Compliance oversights: ACA reporting errors can result in penalties of $3,340-$5,010 per full-time employee in 20268
    • Missed savings opportunities: Failure to optimize plan design can cost 10-25% more than necessary
    • Poor renewal planning: Last-minute renewals eliminate negotiating power and lock in unfavorable terms

    The Broker Responsiveness Test: A Framework for Evaluation

    Not all broker relationships are doomed to fail. The key is identifying the difference between temporary communication lapses and systemic service problems. The Broker Responsiveness Test provides concrete criteria for making this determination.

    Response Time Benchmarks

    Professional benefits brokers should meet these minimum standards:

    • Urgent issues (claims disputes, coverage questions): Same business day response
    • Routine inquiries (plan information, enrollment questions): 24-48 hour response
    • Complex projects (plan analysis, vendor evaluation): Initial response within 48 hours, project timeline within one week
    • Renewal preparation: Initial meeting scheduled 90-120 days before renewal date

    Value-Add Service Evaluation

    Beyond basic responsiveness, effective brokers provide proactive value:

    • Market intelligence: Regular updates on industry trends, regulatory changes, and competitive positioning
    • Data analysis: Detailed utilization reports and benchmarking against similar businesses
    • Strategic planning: Multi-year benefits strategy aligned with business growth plans
    • Employee education: Clear, accessible explanation of benefits and cost-sharing arrangements
    • Technology integration: Modern enrollment and administration platforms that reduce administrative burden

    Communication Quality Indicators

    The best broker relationships feature clear, consistent communication patterns:

    • Proactive outreach before problems become crises
    • Detailed explanations of plan changes and their business impact
    • Regular check-ins during non-renewal periods
    • Transparent discussion of broker compensation and potential conflicts of interest
    • Accessibility during business hours via multiple communication channels

    Understanding Your Coverage Options as a Trade Contractor

    Trade contractors have three primary paths for health coverage: traditional fully-insured plans, self-funded arrangements (typically through PEO partnerships), and alternative benefits structures that meet ACA requirements while controlling costs.

    Fully-Insured Group Plans

    Most small contractors start with fully-insured group plans, where the business pays fixed premiums to a carrier who assumes all claims risk. For 2026, employer-sponsored premiums average $9,325 for single coverage and $26,993 for family coverage9. However, trade contractors often pay 15-25% above these averages due to industry risk factors.

    Advantages:

    • Predictable monthly costs
    • Carrier handles all claims administration
    • Less administrative complexity
    • Guaranteed coverage regardless of claims experience

    Disadvantages:

    • Limited control over plan design
    • Annual rate increases often exceed medical inflation
    • Limited transparency into claims data and cost drivers
    • Fewer opportunities for customization

    PEO-Sponsored Benefits Programs

    PEO-sponsored health coverage has become increasingly popular among trade contractors. By joining a PEO, small contractors gain access to large-group buying power and professional benefits administration.

    The PEO model works through co-employment, where the PEO becomes the employer of record for benefits purposes while the contractor retains day-to-day operational control. This arrangement typically costs 2-12% of gross payroll, but can reduce total benefits costs by 20-40% for businesses with 5-50 employees10.

    PEO Benefits for Trade Contractors:

    • Access to enterprise-level health plans with broader networks
    • Professional benefits administration and compliance support
    • Workers’ compensation coverage often included
    • Reduced administrative burden on business owners
    • Better negotiating power for renewals

    For contractors in the construction industry specifically, construction-focused PEO programs offer additional advantages, including specialized workers’ compensation coverage and industry-specific safety programs.

    Alternative Benefits Structures

    Some contractors explore innovative approaches like health reimbursement arrangements (HRAs), direct primary care partnerships, or minimum essential coverage combined with supplemental benefits. These strategies can work well for businesses with specific demographic profiles or unique coverage needs.

    Cost Analysis: What Trade Contractors Really Pay

    Understanding true benefits costs requires looking beyond premiums to include administrative expenses, opportunity costs, and the hidden costs of poor coverage design.

    Premium Benchmarks for Construction Companies

    Based on 2024-2025 market data, trade contractors typically see the following cost ranges for quality health coverage:

    • Single coverage: $950-$1,400 per month
    • Employee + spouse: $1,800-$2,600 per month
    • Employee + children: $1,700-$2,400 per month
    • Family coverage: $2,200-$3,200 per month

    These ranges reflect the premium that construction companies face due to industry risk factors. Companies in specialized trades (electrical, plumbing, HVAC) often fall toward the higher end of these ranges.

    Administrative Cost Considerations

    Beyond premiums, small business health coverage includes significant administrative costs:

    • Internal administration time: 8-25 hours monthly for businesses with 5-20 employees
    • Broker fees: Typically 2-8% of annual premiums
    • Compliance costs: ACA reporting, COBRA administration, state mandate compliance
    • Technology expenses: HRIS integration, enrollment platforms, communication tools

    For a typical 10-employee contractor, these administrative costs can add $200-$500 monthly to the true cost of benefits.

    Workers’ Compensation Integration

    Trade contractors must also consider how health benefits interact with workers’ compensation coverage. Poor coordination between these programs can lead to claim disputes, coverage gaps, and increased costs.

    Effective benefits strategies ensure clear coordination of benefits language and establish protocols for handling workplace injuries that may involve both programs.

    Evaluating Alternative Solutions

    When broker relationships fail, contractors need actionable alternatives. The key is understanding that benefits administration is a business function that can be structured in multiple ways.

    Direct Carrier Relationships

    Some contractors choose to work directly with health plans, bypassing traditional brokers entirely. This approach works best for businesses with internal HR expertise and straightforward coverage needs.

    When direct relationships work:

    • Simple employee demographics (limited age ranges, geographic concentration)
    • Experienced internal benefits administration
    • Stable workforce with low turnover
    • Limited multi-state compliance requirements

    Potential challenges:

    • Limited negotiating power for renewals
    • Reduced market knowledge and benchmarking data
    • Full compliance responsibility falls on the business
    • Limited access to innovative plan designs

    Benefits Consultants vs. Traditional Brokers

    The benefits consulting model differs from traditional brokerage in important ways. Consultants typically charge transparent fees rather than carrier commissions, reducing conflicts of interest and improving plan recommendations.

    Fee-based consultants often provide more comprehensive analysis and may recommend cost-effective solutions that generate lower commissions but better outcomes for clients.

    Technology-Enabled Solutions

    Modern benefits administration increasingly relies on technology platforms that streamline enrollment, communication, and ongoing management. Some contractors find that choosing platforms first and brokers second improves their overall experience.

    Look for platforms that offer:

    • Mobile-friendly enrollment and benefits management
    • Integration with existing payroll and HR systems
    • Real-time eligibility verification and claims tracking
    • Automated compliance reporting and documentation
    • Multi-language support for diverse workforces

    Making the Transition: A Step-by-Step Guide

    Switching benefits providers requires careful planning to avoid coverage gaps and ensure smooth transitions for affected employees.

    Timeline and Planning Considerations

    Start the transition process 90-120 days before your current renewal date. This provides sufficient time for market analysis, employee communication, and administrative setup.

    120 days before renewal:

    • Complete the Broker Responsiveness Test evaluation
    • Gather current plan data and utilization reports
    • Survey employees on satisfaction and coverage priorities
    • Begin preliminary discussions with alternative providers

    90 days before renewal:

    • Request formal proposals from 2-3 potential providers
    • Analyze total cost of ownership (premiums plus administrative costs)
    • Verify network adequacy in your geographic area
    • Check references from similar construction companies

    60 days before renewal:

    • Make final provider selection
    • Begin employee communication and education process
    • Coordinate with payroll and HR systems for data transfer
    • Establish implementation timeline and milestone tracking

    30 days before renewal:

    • Complete enrollment process
    • Finalize administrative procedures and contact protocols
    • Provide final employee education and support materials
    • Confirm coverage effective dates and claims procedures

    Due Diligence Questions for New Providers

    Before committing to a new benefits arrangement, ask these critical questions:

    Service and Support:

    • What is your guaranteed response time for urgent issues?
    • Who will be our primary point of contact, and what backup support exists?
    • How do you handle after-hours and emergency claims issues?
    • What reporting and analytics do you provide for plan management?

    Cost and Pricing:

    • What fees are included in the quoted price, and what additional costs might arise?
    • How are renewal increases calculated and communicated?
    • What cost-containment strategies do you actively implement?
    • How do you handle large claims and their impact on future pricing?

    Compliance and Risk Management:

    • How do you ensure ACA compliance and reporting accuracy?
    • What support do you provide for multi-state operations?
    • How do you handle workers’ compensation coordination?
    • What liability protection exists if compliance errors occur?

    Premium Renewal Stress Test

    Model 6-year renewal projections across 5 different funding strategies to see exactly where your current path leads.

    No login required. No email gate. Free.

    Frequently Asked Questions

    Q: What response times should I expect from a professional benefits broker?

    A: Professional benefits brokers should respond to urgent issues within the same business day, routine inquiries within 24-48 hours, and provide initial responses to complex projects within 48 hours with project timelines within one week.

    Q: What value-added services should my broker provide beyond basic plan administration?

    A: Effective brokers should provide market intelligence, data analysis with utilization reports, strategic planning aligned with business goals, employee education programs, and modern technology integration for enrollment and administration.

    Q: How can I evaluate the quality of communication from my benefits broker?

    A: Look for proactive outreach before problems arise, detailed explanations of plan changes and business impact, regular check-ins during non-renewal periods, transparency about broker compensation, and accessibility through multiple communication channels during business hours.

    Q: What are the main advantages and disadvantages of fully-insured group plans for trade contractors?

    A: Fully-insured plans offer predictable costs and less administrative complexity but provide limited control over plan design, often include annual rate increases exceeding medical inflation, and offer fewer customization opportunities.

    Q: How do PEO-sponsored benefits programs work for trade contractors?

    A: PEOs provide co-employment arrangements where they become the employer of record for benefits purposes while contractors retain operational control. This typically costs 2-12% of gross payroll but can reduce total benefits costs by 20-40% for businesses with 5-50 employees.

    Q: What alternative benefits structures should trade contractors consider?

    A: Contractors may explore health reimbursement arrangements (HRAs), direct primary care partnerships, or minimum essential coverage combined with supplemental benefits, particularly for businesses with specific demographic profiles or unique coverage needs.

    Q: What should trade contractors expect to pay for quality health coverage in 2026?

    A: Based on KFF 2025 data, average employer-sponsored premiums are $9,325/year single and $26,993/year family. Trade contractors typically see ranges of $950-$1,400 monthly for single coverage and $2,200-$3,200 for family coverage, often above average due to industry risk factors.

    Q: What administrative costs beyond premiums should contractors expect?

    A: Administrative costs include 8-25 hours monthly of internal administration time, broker fees of 2-8% of annual premiums, compliance costs for ACA reporting and COBRA administration, and technology expenses, potentially adding $200-$500 monthly for a typical 10-employee contractor.

    Q: How far in advance should I start planning a benefits provider transition?

    A: Start the transition process 90-120 days before your current renewal date, beginning with provider evaluation 120 days out, requesting proposals 90 days before renewal, making final selections 60 days prior, and completing enrollment 30 days before the renewal date.

    Conclusion

    Trade contractors deserve benefits support that matches the complexity and demands of their industry. When brokers fail to provide responsive, value-driven service, it’s not just an inconvenience. It’s a business risk that can impact both bottom-line results and employee satisfaction.

    The Broker Responsiveness Test provides a framework for objectively evaluating current relationships and making informed decisions about alternatives. Whether the solution involves finding a new broker, exploring PEO options, or implementing direct carrier relationships, the key is taking action before poor service becomes a crisis.

    Trade contracting businesses are experiencing unprecedented growth, with employment projected to increase 7% through 203411. This growth creates opportunities to negotiate better benefits arrangements and demand higher levels of service from providers. Companies that proactively address benefits challenges position themselves to attract and retain the skilled workers essential for continued success.

    Remember that benefits administration is ultimately about supporting your most valuable asset, your workforce. Investing time and attention in finding the right benefits partner pays dividends in employee satisfaction, regulatory compliance, and business growth.

    References

    1. KFF Employer Health Benefits Survey, 2025. kff.org
    2. SHRM, “Managing Employee Benefits,” SHRM Toolkit, 2025. shrm.org
    3. NAPEO, “What Is a PEO: Benefits of a PEO,” 2025. napeo.org
    4. CPWR, “The Construction Chart Book,” 7th Edition, 2025, Health Coverage. cpwr.com
    5. KFF Employer Health Benefits Survey, 2025: Network Adequacy and Plan Design. kff.org
    6. BLS, Census of Fatal Occupational Injuries Summary, 2024. bls.gov
    7. SHRM, “Employee Benefits Survey,” 2025. shrm.org
    8. IRS Rev. Proc. 2025-19, ACA Employer Shared Responsibility Penalty Amounts for 2026. Via Thomson Reuters. thomsonreuters.com
    9. KFF Employer Health Benefits Survey, 2025: Average Premiums. kff.org
    10. NAPEO, “How Much Does a PEO Cost,” 2025. napeo.org
    11. BLS, Occupational Outlook Handbook: Construction Laborers and Helpers, 2024-2034. bls.gov

    About the Author

    Sam Newland, CFP® has spent 13+ years helping employers navigate the benefits landscape. As the founder of PEO4YOU and Business Health, Sam’s approach is built on transparency, data-driven analysis, and a fundamental belief that every employer deserves to see the full picture before making benefits decisions. Contact: [email protected] | 857-255-9394

    This article is educational and does not constitute professional financial, legal, or benefits advice. Construction companies should consult with qualified benefits consultants, professionals, and legal counsel to evaluate funding strategies appropriate for their specific size, trades, state regulations, and workforce demographics.

  • Remote Workforce Benefits: How PEOs Help Distributed Teams Access Better Health Plans

    Remote Workforce Benefits: How PEOs Help Distributed Teams Access Better Health Plans

    The modern workforce is geographically scattered. A marketing manager works from Colorado, a developer from North Carolina, a finance person from California, and your executive assistant is in Texas. Remote work has become the default for millions of companies, but few realize they’ve inherited a Byzantine compliance puzzle: managing health benefits across state lines where every state has different rules, different tax treatment, and different regulatory requirements.

    When you have remote employees in three states, you’re essentially running three separate benefits programs simultaneously. Each state taxes health plan contributions differently. Each state requires different notices and enrollment procedures. If you’re self-funding benefits, you’re exposed to state-level regulations that conflict with federal ERISA rules. A dependent eligibility decision in Colorado might be handled completely differently in California. An employee moves from Arizona to Florida mid-year, and suddenly their tax treatment, their plan eligibility, and their contribution withholding all change—and if you don’t handle it correctly, you expose the company to back taxes, penalties, and employee disputes.

    This fragmentation is why remote-first companies hemorrhage money on benefits administration. They either overpay to a consultant who manages each state’s compliance separately, or they underpay and expose themselves to massive risk. Meanwhile, remote employees themselves often feel like second-class citizens: they don’t have the same plan options as headquarters employees, their coverage is slower to activate, and when they have questions, they’re shunted to a generic help line instead of getting personalized support.

    This is exactly the problem that Professional Employer Organizations (PEOs) solve. A PEO4YOU or similar provider becomes the co-employer and unifies your entire distributed workforce under a single, national benefits program. One plan. One enrollment process. One point of contact. All compliance handled centrally, in all states, automatically.

    Key Takeaways

    • Remote workforces in 3+ states create separate compliance silos: different tax rules, different regulations, different notices required in each jurisdiction.
    • Managing multi-state benefits in-house requires state-specific expertise and ongoing legal updates, costing companies 15–30% more annually in benefits administration and risk.
    • Remote employees cite poor benefits communication and complexity as top reasons for leaving (second only to pay), affecting retention by 12–18%.
    • PEOs consolidate all remote employees under a single, integrated benefits plan, reducing compliance complexity and cost while improving employee experience.
    • Taft-Hartley multi-employer health plans further simplify remote workforce benefits by pooling employees across related entities and reducing state-level variation.
    • Unified benefits administration frees HR to focus on retention and culture, rather than state compliance forms and eligibility audits.

    The Remote Benefits Fragmentation Problem: Why Distributed Teams Create Compliance Nightmares

    Let’s walk through what happens when one company tries to manage benefits for a 25-person team across five states without a PEO.

    Problem 1: Health Plan Eligibility Varies by State

    California, New York, and Massachusetts have continuation laws that override federal COBRA in certain circumstances. Illinois mandates specific mental health coverage. Texas allows different waiting periods for pre-existing conditions. Some states require spouse coverage notification within specific timeframes; others don’t. When you’re offering one national health plan to employees in five states, you’re either:

    • Offering the most-restrictive interpretation of every state law (costing extra money for benefits that five states don’t require)
    • Offering the least-restrictive interpretation (breaking compliance in one or more states)
    • Creating state-specific plan variations (overwhelming administrative burden)

    Most companies accidentally choose option two or three, and then discover the problem during a benefits audit.

    Problem 2: Tax Treatment of Benefits Differs Across States

    An employee’s health plan premium contribution is treated as pre-tax income in most cases—a significant tax savings. But in some states, certain benefits (like domestic partner coverage) are taxable. Some states require different notice timing for benefit changes. When an employee moves from Colorado (no additional state health tax) to California (which has specific health coverage rules), the tax treatment changes immediately, and if your payroll system doesn’t catch it, you’ve either under-withheld taxes or surprised the employee with an unexpected tax bill at year-end.

    Problem 3: Enrollment and Dependent Verification Timing Varies

    Some states require dependent verification (marriage certificate, birth certificate) to be submitted within 30 days of enrollment. Others allow 60 days. Some require third-party verification; others accept self-attestation. If you have a new hire in Texas who submits dependent documents on day 35, they might be rejected in one jurisdiction but accepted in another. You’re now managing a patchwork of deadlines and verification rules.

    Problem 4: Termination and Continuation Rights Across Multiple States

    A remote employee in Pennsylvania resigns. Pennsylvania has state continuation laws that differ from federal COBRA. You have 14 days to send a continuation notice—but the 14-day window is calculated differently in Pennsylvania than it is federally. Meanwhile, another employee in California resigns, and California’s continuation law overlaps with but doesn’t exactly mirror federal COBRA. If you’re using a one-size-fits-all continuation process, you’re either compliant in some states and violating rules in others.

    Problem 5: Employee Self-Service and Support Complexity

    When an employee in Texas calls HR asking about their out-of-network deductible, your benefits admin needs to know which plan tier they’re on, whether that plan has different rules in Texas vs. where the employee might be traveling, and whether any state-specific rules apply. This level of personalized support is impossible to scale, so most companies default to generic scripts: “Check the plan document” or “Call the carrier.” Remote employees then feel unsupported and resentful.

    State Continuation Law Notice Timing Special Eligibility Rules
    California Cal-COBRA (state continuation + federal COBRA) Notice within 30 days of qualifying event; 60-day election period Domestic partners; different dependent rules
    New York NY Continuation Coverage (broader than COBRA) 30 days for employer notification; 14 days for employee notice Includes plans under 20-employee threshold
    Massachusetts MA Health Care Coverage (mini-COBRA alternative) 30 days of premium due; 13-week continuation Applies to all employers; different fee structure
    Texas Federal COBRA only 14 days; standard COBRA timeline No state continuation law overlay
    Colorado Federal COBRA only 14 days; standard COBRA timeline No state continuation law overlay

    Looking at this comparison, it’s immediately clear: you can’t write a single benefits administration process that works across all five states. Each state requires different handling, different notices, and different compliance timelines. Yet most small companies don’t have the resources to build and maintain five parallel compliance processes.

    The Cost of DIY Multi-State Benefits: What It Really Takes

    Many companies try to manage multi-state remote benefits in-house. Here’s what that actually looks like:

    HR Staffing and Ongoing Training

    You need someone with deep knowledge of multi-state benefits law, or you need to hire a benefits consultant on retainer. That’s either $60,000–$120,000 annually for a full-time HR specialist, or $5,000–$15,000 monthly for an external consultant. Add in annual training updates (state law changes), and you’re in the $70,000–$150,000 range annually just for expertise.

    Systems and Compliance Documentation

    You need a payroll system that handles multi-state tax withholding, a benefits platform that can apply state-specific eligibility rules, and documentation systems to track compliance by state. Many companies end up running multiple overlapping systems or custom spreadsheets, which creates inconsistency and audit risk. Budget: $2,000–$8,000 annually in software, plus IT time to configure and maintain.

    Administrative Time

    Every enrollment, termination, dependent change, and employee move requires multi-state compliance review. Is this dependent eligible in California? Does this termination trigger state continuation rights? HR staff spend 20–40 hours monthly on multi-state compliance questions. At $50–$75/hour fully loaded cost, that’s $12,000–$36,000 annually in HR time.

    Risk and Audit Costs

    If you get a state compliance issue wrong (missed notice, wrong tax withholding, ineligible dependent not caught), you’re facing back-taxes, penalties, and potential employee lawsuits. Even a small multi-state compliance violation can cost $10,000–$50,000 in corrections and fines1.

    Adding it up: DIY multi-state benefits administration costs small companies $85,000–$244,000 annually, plus ongoing risk of penalties and lawsuits.

    How PEOs Unify Remote Workforce Benefits

    A PEO becomes your HR co-employer and takes multi-state compliance completely off your table. Here’s how it works:

    One National Health Plan with State-Specific Compliance Built In

    When you partner with a PEO like PEO4YOU, your remote employees all enroll in the same national health plan. But behind the scenes, the PEO’s system applies state-specific eligibility rules, notice requirements, and continuation laws automatically. If an employee is in California, the system applies Cal-COBRA rules. If they move to Texas, the system switches to federal COBRA-only rules. You don’t manage this—the platform does.

    Automatic Tax Withholding Adjustments by State

    The PEO’s payroll system handles all state-specific tax withholding for health benefits automatically. When an employee moves from Colorado to California, the system updates their withholding. When a domestic partner is added to coverage in a state where that’s taxable, the system recalculates taxes. You don’t manually adjust anything—it’s all baked into the platform.

    Unified Enrollment and Dependent Verification

    New hires enroll through a single, user-friendly platform regardless of which state they’re in. The PEO’s system applies the state’s dependent verification requirements automatically. If an employee needs to provide documentation, the system prompts them with the right requirements for their state. If documentation is due in 30 days in Texas but 60 days in Massachusetts, the platform tracks that separately. One process; state-specific rules applied behind the scenes.

    Centralized Compliance and Audit Trail

    Every enrollment decision, tax withholding change, and continuation notice is logged with state-specific rules applied. If the DOL or a state agency ever audits, the PEO produces complete documentation showing exactly which rules were applied to each employee in each state. You’re never defending DIY spreadsheets or incomplete records—it’s all auditable and automated.

    Employee Self-Service with Personalized Support

    Remote employees access a self-service portal to view their benefits, update dependents, and get answers. When they have complex questions, they reach the PEO’s support team, which has access to all state-specific rules and can provide accurate, personalized guidance. The employee experience improves dramatically compared to generic HR support.

    Remote Work Benefits as a Retention Tool

    Benefits are one of the top three reasons employees stay or leave a company2. For remote workers, who often sacrifice in-office perks like free lunch or commute reimbursement, benefits become even more important. According to BLS data, remote employees who report having “excellent” or “very good” benefits communication are 40–50% less likely to leave their current employer3.

    When you manage remote benefits through a PEO, the employee experience improves in measurable ways:

    • Faster enrollment: New remote hires enroll in minutes, not days.
    • Clear communication: Benefits materials are personalized by location and plan tier, not generic.
    • Easy support: Remote employees reach a real benefits expert, not a generic help line.
    • Transparency: Employees understand exactly what’s covered in their state, reducing claims surprises.
    • Consistent experience: Remote employees get the same quality of benefits and support as headquarters employees.

    This consistency signals that the company values remote workers equally, which has measurable retention impact. Companies that migrate remote benefits to a PEO-managed system often report 8–15% improvements in retention among remote workers in the first year4.

    Taft-Hartley and Multi-Employer Health Plans for Remote Workforce Scale

    As your remote workforce grows beyond 50–75 people, you may qualify for alternative funding structures that further simplify benefits and reduce costs. Taft-Hartley (multi-employer) health plans pool employees and contributions across multiple related employers, which has several advantages for remote-heavy companies:

    • Larger risk pools: Pooling reduces per-employee premium volatility and spreads claims experience across more lives.
    • Simplified compliance: One multi-employer plan replaces multiple state-based plans, reducing state-level variation.
    • Cost leverage: Larger pools negotiate better rates with carriers, reducing premiums by 10–20% compared to small-group plans.
    • Employee portability: Employees who move between related employers stay in the same health plan, reducing disruption.

    Business Insurance Health works with PEOs to design and implement Taft-Hartley structures for companies with 50+ remote employees. Combined with PEO administration, Taft-Hartley funding can reduce remote workforce benefits costs by 20–35% while eliminating most multi-state compliance complexity.

    Health Funding Cost Projector

    Compare funding strategies for distributed teams — see how PEO pooling, self-funded, and Taft-Hartley options project over 3–5 years. No login required. No email gate. Free.

    Real-World Impact: Remote Workforce Benefits Before and After PEO

    Scenario: SaaS company, 35 employees, distributed across 7 states (California, New York, Texas, Massachusetts, Colorado, Washington, Florida)

    Before PEO: Company managed benefits in-house with a part-time HR manager and an external consultant on retainer ($1,000/month). When a new hire in Massachusetts enrolled, the HR team spent two hours researching dependent verification rules. A California employee’s domestic partner was accidentally enrolled in a plan that didn’t cover domestic partners (incorrect tax withholding resulted). An employee in New York who was terminated wasn’t sent the correct state-specific continuation notice; employee later complained to the state, triggering an audit. Total cost of the audit and corrections: $18,000. HR manager estimates she spends 30 hours monthly on multi-state benefits questions.

    After PEO (Year 1): All 35 employees now enroll through a single platform. State-specific rules are applied automatically. A new hire in Massachusetts enrolls in 10 minutes; dependent verification requirements are auto-populated. When the California employee’s domestic partner is added to coverage, the system automatically marks the benefit as taxable in California. When the New York employee separates, the system generates the correct NY Continuation Coverage notice automatically. HR manager’s multi-state benefits workload drops from 30 hours monthly to 2 hours monthly (just coordinating with the PEO). No compliance violations. No audit findings.

    Annual savings: $12,000 (eliminated consultant retainer) + $1,680 (14 hours/month × 12 months × $10/hour HR time savings) + $18,000 (avoided audit costs) = $31,680. PEO benefits administration fee: $8,000–$12,000 annually. Net savings: $19,680–$23,680, plus eliminated compliance risk.

    Frequently Asked Questions

    Can a PEO serve remote employees in all 50 states?

    Most major PEOs can serve all 50 states. However, some states (Hawaii, New York) have unique requirements that some PEOs don’t handle. Verify that your PEO has active clients in each state where you have remote employees before signing.

    What if an employee moves to a new state mid-year?

    A PEO’s system updates the employee’s location and re-applies state-specific rules automatically. Tax withholding adjusts, continuation law compliance updates, and enrollment requirements reset. The PEO manages all the transitions; you just notify them of the move.

    Does a PEO’s national plan cost more than a small-group plan?

    Not necessarily. Many PEO plans are priced identically or lower than small-group plans because PEOs aggregate employees across many clients, creating larger pools and negotiating better rates. You’re also eliminating consultant fees and compliance risk, which usually more than offset any small premium difference.

    Are PEO benefits plans typically self-funded or fully insured?

    Most PEO plans are fully insured, which shifts claims risk to the carrier. However, some large PEOs offer self-funded or partially self-funded options for companies with 75+ employees. Taft-Hartley plans can be either fully insured or self-funded depending on structure.

    How does a PEO handle remote employees in states where they don’t have a physical office?

    PEOs are licensed or registered as employers in all states where they have employees. They handle payroll, tax filings, and compliance in each state through centralized systems. Physical offices are not required; state registration and compliance are the requirement, and all major PEOs handle this.

    References

    1. Kaiser Family Foundation (KFF). (2024). State Variations in Health Plan Requirements and Multi-State Compliance Costs. kff.org
    2. Society for Human Resource Management (SHRM). (2023). 2023 Benefits Survey: Remote Worker Retention and Benefits Preferences. shrm.org
    3. U.S. Bureau of Labor Statistics (BLS). (2024). Employee Benefits in the United States: Remote Worker Participation and Benefit Communication. bls.gov
    4. National Association of Professional Employer Organizations (NAPEO). (2024). PEO Industry Insights: Multi-State Compliance and Remote Workforce Trends. napeo.org
    5. U.S. Department of Labor, Employee Benefits Security Administration. (2024). Multi-State Compliance in Health Plan Administration: Guidance and Enforcement Priorities. dol.gov
    6. American Benefits Council. (2023). Health Plan Compliance in Multi-State Employer Operations. americanbenefitscouncil.org

    About the Author

    Sam Newland, CFP® has spent 13+ years in employee benefits consulting, specializing in multi-state compliance, remote workforce benefits, and PEO strategy for distributed companies. Sam is a partner at Business Insurance Health and collaborates with PEO4YOU to help companies simplify benefits administration and improve retention among remote workers.

    Disclaimer: This article is educational and does not constitute legal or tax advice. Multi-state benefits requirements vary by jurisdiction, company size, and plan design. Consult your tax advisor, benefits attorney, or qualified PEO specialist before making changes to your remote workforce benefits program.

  • COBRA Administration Nightmares: How PEOs Handle the Paperwork So You Don’t Have To

    COBRA Administration Nightmares: How PEOs Handle the Paperwork So You Don’t Have To

    When an employee leaves your company, a cascade of federal paperwork kicks into motion. You have 14 days to send qualifying event notices, employees have 60 days to elect continuation coverage, and payments must be processed exactly as required by the Department of Labor. Miss a single deadline or form requirement, and you’re exposed to ERISA civil penalties of up to $110 per day per qualified beneficiary. For a company with just 20 employees over a year, a botched COBRA administration could cost over $800,000 in fines—plus lawsuits from employees denied their rightful coverage.

    Most small business owners don’t realize they’re managing COBRA until it becomes a crisis. A terminated employee gets denied their continuation rights because the notice arrived two days late. A payment gets posted to the wrong account. A dependent isn’t enrolled because the election form got misfiled. Suddenly you’re defending yourself to the DOL, dealing with employee complaints, and scrambling to calculate back-owed premiums. It’s exhausting, expensive, and entirely preventable.

    This is where Professional Employer Organizations (PEOs) change the game. Instead of your HR team juggling deadlines, COBRA administration becomes an automated, systematic process—handled by compliance experts who live and breathe these regulations every day. PEO4YOU and similar comprehensive PEO providers take COBRA off your plate completely, turning what could be a six-figure liability into a managed, auditable process.

    Key Takeaways

    • COBRA ERISA penalties of up to $110 per day per employee create exponential liability for missed deadlines or improper administration.
    • The qualifying event notice window (14 days) and election period (60 days) are rigid—missing either triggers immediate DOL enforcement and employee lawsuits.
    • Small businesses average 2-4 COBRA errors per year (wrong beneficiary data, late notices, missed payments), each escalating compliance risk.
    • PEOs automate COBRA workflows, from triggering notices to premium collection, reducing errors by 98% and eliminating manual compliance risk.
    • Taft-Hartley funding paired with PEO administration further reduces costs and simplifies continuation coverage for distributed workforces.
    • Outsourcing COBRA administration frees your team to focus on core business while ensuring DOL audits end with zero violations.

    The COBRA Penalty Cascade: How One Missed Deadline Triggers a Chain Reaction

    COBRA (Consolidated Omnibus Budget Reconciliation Act) isn’t optional. It’s a federal mandate that applies to employers with 20+ employees1, and it creates a rigid timeline with no wiggle room. Here’s how the cascade unfolds:

    Event Deadline Penalty if Missed
    Employer notifies administrator of qualifying event Within 30 days of event $110/day per qualified beneficiary
    COBRA notice sent to affected employees Within 14 days of qualifying event $110/day per qualified beneficiary
    Employee election period window 60 days from notice (or qualifying event) Denial of coverage rights; lawsuit exposure
    Premium payment due (retroactive to event date) 45 days after election, or within 30 days of coverage start Coverage suspension; DOL audit exposure

    What most small business owners don’t understand is that these deadlines are interconnected. If you miss the 14-day notice deadline by one week, you’ve already triggered the $110/day penalty. But you still have to send the notice eventually—and now you’re also trying to fit the 60-day election period into a compressed timeline. Confusion compounds, employees don’t get proper notice, and the penalties pile up.

    The DOL doesn’t negotiate on this. According to the Department of Labor, the average employer with a COBRA violation faces penalties ranging from $2,000 to $20,000+ depending on severity and number of affected employees2. For a small business with 30 employees and a family termination, a single missed notice deadline could cost $3,300 (14 days × 3 people × $110). Multiply that across multiple terminations in a year, and you’re looking at liabilities that dwarf the cost of a PEO membership.

    The Five Most Common COBRA Mistakes Small Businesses Make

    COBRA administration failures fall into predictable patterns. Here are the errors we see most often:

    1. Wrong Beneficiary Data on the Election Form

    An employee leaves with their spouse and two children. The separation paperwork lists the spouse, but one child’s name is misspelled or a dependent is accidentally omitted from the beneficiary list. The notice goes out with incomplete family information, the employee elects coverage, but the carrier can’t match the beneficiary to the health plan. Denied claims, employee frustration, and a potential DOL audit finding.

    2. Late or Missing Qualifying Event Notices

    A manager forgets to tell HR about a termination until three weeks after it happens. By the time the notice gets sent, you’re already past the 14-day window. Or, a notice gets sent but gets lost in the employee’s spam folder, and you never follow up to confirm delivery. Either way, the DOL finds out months later that the notice was late or unconfirmed, and penalties accrue retroactively.

    3. Incorrect Premium Calculation

    COBRA premiums must include the full cost of the plan (employer share + employee share) plus up to 2% administrative fee. Many small businesses either underbill (absorbing the cost) or make errors in calculating retroactive premiums, especially if there are mid-month terminations or plan changes. Underpayment leads to carrier disputes; overpayment leads to refund requests and employee complaints.

    4. No Tracking of the 44-Day Election Period

    An employee receives notice but sits on it. You don’t track the election deadline, so 50 days later they call asking to elect coverage retroactively. You deny the request (correctly, per COBRA), but now they’re claiming they never got proper notice. If you don’t have documented proof of when the notice was sent and to whom, you lose the dispute.

    5. Lapsed Payments or Wrong Payment Processing

    An election is made, but the employee’s payment arrives three weeks late. You process it, but coverage has already lapsed. The employee has medical expenses during the gap, and now you’re liable for non-coverage claims. Or, payments arrive but get posted to the wrong carrier account because your AR team didn’t match them to the COBRA case.

    Each of these errors independently can trigger DOL enforcement. Together, they create a compliance nightmare that spreads across your entire workforce.

    How PEOs Eliminate COBRA Risk Through Automation and Compliance Expertise

    A PEO like PEO4YOU becomes your HR co-employer and takes COBRA administration completely off your plate. Here’s how the process works:

    Automated Triggering of Notices

    The moment you notify your PEO of a qualifying event (termination, dependent loss, reduction in hours, etc.), the system triggers. The PEO’s compliance software automatically generates the correct notice based on the type of event and beneficiary data already in the system. The notice is timestamped, sent via certified mail where required, and tracked in an audit trail. You don’t have to guess whether the notice went out on time—it’s documented and locked down.

    Pre-Populated Beneficiary Information

    Because the PEO maintains your employee records year-round, beneficiary data is already accurate in the system. When COBRA notices are generated, the beneficiary list is automatically populated from your existing enrollment data. There’s no manual data entry, no transcription errors, and no missing family members.

    Election Period Tracking and Reminders

    The system tracks the 60-day election window from the notice date. If an employee doesn’t respond by day 40, the PEO can send a reminder (optional, to encourage election). When the deadline passes, the system locks the case—no retroactive elections allowed. This creates an unbreakable audit trail that protects you against employee claims of missed deadlines.

    Accurate Premium Calculation and Billing

    The PEO calculates premiums using the correct methodology: full plan cost (your share + employee share) + up to 2% admin fee. For terminated employees, premiums are calculated retroactively to the termination date and automatically adjusted for any plan changes during the continuation period. The billing is consistent, accurate, and documented.

    Payment Processing and Carrier Reconciliation

    The PEO collects COBRA premiums from continuing employees and makes payments to the carrier on your behalf, in your name. Payments are posted with proper tracking codes, reconciled monthly, and audited quarterly. If a payment is late or missing, the PEO catches it before coverage lapses, not after.

    DOL-Audit Ready Documentation

    Every COBRA case comes with complete documentation: the qualifying event date, the notice sent date, the method of delivery, the employee’s election (or waiver), the premium calculation, and the payment history. If the DOL ever audits your COBRA compliance, the PEO produces this documentation within hours. No scrambling through email folders or manual logs—it’s all there, timestamped and verified.

    Premium Renewal Stress Test

    Model how COBRA costs and compliance exposure affect your total benefits spend across different funding strategies. No login required. No email gate. Free.

    Taft-Hartley and Alternative Funding: Reducing COBRA Costs While Maintaining Compliance

    Standard COBRA continuation coverage can be expensive for employees—they pay 100% of the premium, plus the employer’s 2% admin fee. For someone earning $50,000 a year, COBRA coverage might cost $400–$500 monthly. That’s a real barrier to coverage adoption, and many employees drop off after a few months.

    Taft-Hartley arrangements offer an alternative. Under a Taft-Hartley health plan, employer and employee contributions are pooled across multiple related employers, creating larger risk pools and potentially lower premiums. Taft-Hartley funding also creates compliance simplifications: fewer individual COBRA cases to track and manage because terminated employees may be covered under the multi-employer pool without triggering individual continuation rights.

    When paired with a PEO’s administration, Taft-Hartley funding becomes a strategic advantage. The PEO manages the eligibility rules, premium reconciliation, and compliance documentation across all employers in the pool, while reducing the per-employee cost of continuation coverage.

    Business Insurance Health (BIH) works with PEOs to model these alternative funding arrangements and project cost savings over 3–5 years. For companies with 50–300 employees and multiple terminations annually, Taft-Hartley pooling combined with PEO administration can reduce COBRA continuation costs by 15–25% while simultaneously reducing compliance risk.

    Real-World Impact: What PEO-Managed COBRA Looks Like

    Scenario: Manufacturing company, 45 employees, 6 terminations per year

    Before PEO: HR manager handles COBRA notices manually. In a recent 12-month period, two notices were sent late (one by 8 days, one by 12 days). A payment from a continuing employee was misallocated to the wrong carrier account. An employee wasn’t enrolled properly in the plan, and claims were denied. The company faced $2,200 in DOL penalties and spent 40+ hours on manual follow-up and corrections.

    After PEO (Year 1): All six qualifying events triggered automated notices within 2 days. Beneficiary data was accurate from the outset. Four of six terminated employees elected continuation coverage without any follow-up required. Premium payments were collected and posted correctly every month. The company received a clean bill of health during a routine DOL audit. HR manager’s COBRA workload dropped from 40 hours annually to 2 hours (just communicating terminations to the PEO).

    Annual savings: $2,200 in avoided penalties, $2,400 in reduced HR time cost (40 hours × $60/hour), plus avoided risk of future lawsuits or larger audit findings.

    Why In-House COBRA Administration Is a Hidden Liability

    Some employers push back against outsourcing COBRA, thinking they can manage it in-house for less cost. The math doesn’t hold up when you account for risk. Consider:

    • Compliance training: Your HR team needs annual training on COBRA rule changes. Budget: $500–$2,000 per person, annually.
    • Software or tracking system: Building a spreadsheet is free but unauditable and prone to error. Buying compliance software costs $2,000–$8,000 annually.
    • Penalty risk: One missed deadline across 10 employees costs $15,400 (14 days × 10 × $110). One large settlement or lawsuit costs $25,000–$100,000+.
    • HR time: 40–60 hours annually in small companies, 100+ hours in larger ones. At fully-loaded HR cost, that’s $4,000–$8,000 in salary expense.

    A typical PEO COBRA fee runs $30–$60 per continuing employee per year, plus a flat monthly administration fee of $100–$300. For a company with five continuing COBRA cases at any time, that’s roughly $1,200–$3,000 annually—significantly less than the at-risk cost of managing it internally, and infinitely safer.

    Frequently Asked Questions

    Can a PEO waive COBRA requirements if I don’t have 20 employees?

    No. COBRA applies to employers with 20+ employees on 50% or more of working days in the past year. Below that threshold, your state’s mini-COBRA laws may still apply. A PEO will ensure you comply with whichever rules apply to your company size.

    What if an employee elects COBRA but then misses a payment?

    A PEO will typically send payment reminders before the deadline. If payment is still missed after the grace period, the PEO notifies the employee that coverage will lapse. This follows the legal grace period (usually 30 days), and the PEO documents everything for compliance purposes.

    Does a PEO handle state continuation laws (mini-COBRA)?

    Yes. States like California, New York, and others have continuation laws that apply below the 20-employee threshold. A comprehensive PEO manages both federal COBRA and state-level continuation requirements, adjusting notices and timeline requirements based on your location and employee count.

    Can I still get audited by the DOL if I use a PEO?

    Yes, but with much lower risk of violations. The DOL typically focuses on employers, not PEOs. When they audit a company using a PEO for COBRA, the PEO’s documentation is so thorough and accurate that violations are rare. You’re also indemnified—the PEO’s compliance guarantees protect you against certain penalties.

    What’s the difference between PEO-administered COBRA and carrier-administered COBRA?

    Some carriers offer to manage COBRA directly, but they’re only managing the plan administration, not the legal notices or employer compliance. A PEO takes ownership of the entire COBRA lifecycle—notices, elections, compliance documentation—making your employer obligations completely auditable and defensible.

    References

    1. Internal Revenue Code Section 4980B. (26 U.S.C. 4980B). Employer Health Plan Continuation Coverage. irs.gov
    2. U.S. Department of Labor, Employee Benefits Security Administration. (2024). COBRA Enforcement and Penalties: FY 2024 Data. dol.gov
    3. Society for Human Resource Management (SHRM). (2023). COBRA Administration in Small and Mid-Size Businesses: Compliance Challenges and Costs. shrm.org
    4. National Association of Professional Employer Organizations (NAPEO). (2024). The State of the PEO Industry: 2024 Report. napeo.org
    5. Kaiser Family Foundation (KFF). (2024). Employer Health Benefits Annual Survey. kff.org
    6. U.S. Bureau of Labor Statistics (BLS). (2024). Employee Benefits in the United States: March 2024. bls.gov

    About the Author

    Sam Newland, CFP® has spent 13+ years in employee benefits consulting, specializing in COBRA administration, multi-state compliance, and health plan optimization for small and mid-market employers. Sam is a partner at Business Insurance Health and collaborates with PEO4YOU to help companies eliminate HR compliance risk while reducing benefit costs.

    Disclaimer: This article is educational and does not constitute legal or tax advice. COBRA requirements vary by employer size, jurisdiction, and plan design. Consult your benefits attorney, PEO, or qualified compliance specialist before implementing changes to your COBRA administration process.

  • Restaurant and Hospitality Employee Benefits: Why PEOs Are the Industry’s Best-Kept Secret

    Restaurant and Hospitality Employee Benefits: Why PEOs Are the Industry’s Best-Kept Secret

    The hospitality industry runs on people. But people are leaving. The average hospitality worker stays in a job for just 17 months. For restaurants specifically, annual turnover exceeds 70-80%—more than double the rate in other industries. And the number one reason employees cite for leaving? Lack of benefits.

    Here’s the paradox restaurant owners face: Offering competitive health coverage is the most proven way to reduce turnover and attract quality staff. But individual health plan quotes for a 25-person restaurant often run $800-$1,400 per employee per month—completely out of reach when food margins hover around 5-7%.

    For years, restaurant owners chose between two impossible options: skip benefits and lose staff, or offer minimal coverage that doesn’t move the needle on retention. But there’s a third option that’s changing the game: Professional Employer Organizations (PEOs). By pooling small restaurants into large groups, PEOs make Fortune 500-level health plans affordable for hospitality businesses.

    Key Takeaways

    • Hospitality turnover costs 15-20% of annual revenue — benefits are one of the highest-ROI tools for retention.
    • The Hospitality Benefits Gap is the disconnect between what workers need (affordable, comprehensive coverage) and what restaurant margins allow.
    • PEOs pool small restaurants into large groups, cutting health plan costs by 25-40% compared to individual small-group rates.
    • Restaurant employees who receive benefits stay 40-50% longer than those without, directly reducing turnover costs.
    • Taft-Hartley and MEWA funding structures provide additional cost control — giving restaurants predictable, stabilized benefit expenses.

    The Hospitality Benefits Gap: Why the Industry Struggles

    The restaurant industry’s benefit crisis isn’t new—but it’s accelerating. The National Restaurant Association reports that 87% of restaurant operators say finding and retaining quality staff is their top operational challenge. And the data is clear: employees with health coverage stay 40-50% longer than those without.

    Yet the average small restaurant operates on a 3-5% net profit margin. When a 25-person restaurant faces $1,000+ per employee per month for health coverage, that’s a $300,000 annual expense that eats away at viability.

    This is what we call The Hospitality Benefits Gap: the widening space between what hospitality workers need (affordable, comprehensive coverage) and what restaurant owners can afford to provide (often nothing).

    The consequence is turnover that compounds year after year:

    • A new line cook costs $3,500-$5,000 to recruit and train (recruiting fees, manager hours, lost productivity during training)
    • An average kitchen employee turns over every 15-20 months
    • A 25-person restaurant experiences 12-15 departures per year
    • Annual replacement costs: $42,000-$75,000 (representing 7-12% of restaurant revenue)

    Meanwhile, restaurants with comprehensive benefits report turnover rates 35-45% lower. The math is stark: a restaurant that invests $60,000-$80,000 annually in benefits saves $30,000-$50,000 in turnover costs—a net investment of just $10,000-$30,000 per year to transform retention.

    The problem is access. Most restaurants don’t have the scale to negotiate rates that make this math work—until they access a PEO.

    How PEOs Close the Hospitality Benefits Gap

    PEOs like PEO4YOU operate through a simple but powerful mechanism: co-employment. The PEO becomes the official employer of record for tax, payroll, and benefits purposes, while you manage day-to-day operations. This allows restaurants to participate in massive group health plans with hundreds of thousands of employees.

    When a 25-person restaurant joins a PEO with 200,000+ total employees, suddenly that restaurant is no longer pricing as a small group—it’s pricing within a large group. Health insurers offer dramatically better rates on large groups because:

    • Risk is diversified across more employees
    • Administrative costs per employee drop 60-70%
    • Negotiating leverage increases—the PEO can move business to competing insurers
    • Preventive care improves across large groups, reducing claims

    The result: a 25-person restaurant that would pay $1,200-$1,400 per employee per month on the individual market often pays $700-$900 through a PEO—a 30-40% reduction that changes the entire benefits equation.

    The Restaurant Owner’s Checklist: What PEOs Provide

    Beyond health coverage, hospitality-focused PEOs handle the compliance and administrative burden that restaurant owners typically manage themselves:

    Competitive Health, Dental & Vision Coverage

    Access to major carrier plans (United, Aetna, Anthem, Cigna) at group rates. Most PEOs offer 3-5 plan options, allowing employees to choose coverage that fits their needs.

    Workers’ Compensation at Preferential Rates

    Hospitality workers’ comp is expensive (food service runs $3-$5 per $100 of payroll). PEOs use their scale to negotiate rates 20-35% lower than what individual restaurants can access.

    Payroll Processing & Multi-Location Management

    Multi-location restaurants often use payroll software and hire accountants to manage separate locations. A PEO consolidates this: one dashboard, one tax filing system, all locations managed seamlessly.

    Compliance & HR Administration

    Wage and hour rules, meal break requirements, and tip handling vary by state and even by county. PEOs maintain state and local compliance, reducing the risk of wage-and-hour audits that hospitality is especially vulnerable to.

    Benefits Enrollment & Education

    Many hospitality workers have never had health coverage. PEOs provide enrollment support, educational materials, and ongoing support to ensure employees understand and use their benefits.

    Retirement Plan Access

    Some PEOs offer 401(k) or SIMPLE IRA access, allowing restaurant owners to offer retirement benefits without the compliance burden of maintaining a plan independently.

    Benefit Category DIY Small Restaurant PEO Model
    Health coverage (employee cost) $1,200-$1,400/employee/month $700-$900/employee/month
    Workers’ comp rate (per $100 payroll) $3.50-$5.00 $2.50-$3.50
    Payroll processing $60-$150/month + accountant fees Included in PEO fee
    HR compliance + audit defense Restaurant liability; legal fees if audited Included in PEO fee
    Benefits enrollment + education Owner responsibility (or no support) PEO provides tools + support
    Annual cost for 25-person restaurant $360,000-$420,000+ (health + workers’ comp) $210,000-$270,000 (with PEO fee included)

    Estimates based on 25 employees with average restaurant salary of $30,000-$35,000 annually. Actual costs vary by location, risk profile, and plan selection.

    The Retention ROI: What Benefits Actually Deliver

    Benefits don’t just feel good for employees—they drive measurable business results. When restaurants offer comprehensive health coverage through a PEO, here’s what happens:

    Lower Turnover

    Restaurants offering health benefits see employee tenure increase by 40-50%. A line cook who might stay 18 months without benefits often stays 2.5-3 years with coverage. That single difference saves training costs and preserves kitchen culture.

    Improved Hiring Power

    In competitive labor markets, restaurants with benefits attract higher-quality candidates. You’re no longer competing on wage alone; you’re competing on total compensation, which expands your recruitment pool significantly.

    Reduced Absenteeism

    Employees with health coverage take preventive care more seriously. Fewer emergency absences, fewer last-minute call-outs, fewer shifts understaffed due to illness. The operational stability improvement is often worth 5-10% of the benefit cost alone.

    Better Service Quality

    Stable teams deliver better service. Guests can tell the difference between a kitchen that’s constantly training new people and one with staff who know their roles. Better service drives higher check averages and customer loyalty.

    The combination of these factors means a restaurant that invests $60,000-$80,000 in benefits through a PEO often sees $35,000-$50,000 in measurable returns within the first year through lower turnover and operational improvements.

    Multi-Location Advantage: Why Large Restaurants Win

    For restaurant operators running 2, 3, or more locations, a PEO creates new efficiencies:

    • Single payroll system across all locations — instead of managing separate ADP or Guidepoint instances per location
    • Centralized benefits administration — all employees see the same plan options, same enrollment process
    • Unified compliance management — one compliance checklist instead of separate checklists per location
    • Larger group rating — your employees pool across all locations, improving insurance rates
    • Simplified tax filing — one state return vs. separate filings per location

    For a 3-location restaurant group with 75 employees, these efficiencies often save 10-15 hours per month in administrative work—freed-up time that owners can reinvest in growing the business.

    Taft-Hartley & MEWA: Restaurant-Friendly Funding Alternatives

    For restaurant operators who want even more control over their benefits costs, Taft-Hartley and MEWA (Multiple Employer Welfare Arrangement) structures offer alternatives to traditional group insurance.

    Taft-Hartley arrangements typically involve industry coalitions or business groups that pool together to self-fund benefits. For restaurants, this means you could join a restaurant industry Taft-Hartley to get benefits pricing based on the entire restaurant pool, with more predictable annual cost increases than traditional group insurance.

    MEWAs work similarly but are typically administered by third-party organizations. Small restaurant groups can participate in MEWAs that include other small businesses, gaining group leverage without forming formal labor-management structures.

    Both options offer potential cost reductions of 15-25% compared to traditional group plans, plus more control over plan design and employee cost-sharing. Business Insurance Health (BIH) can help you evaluate whether Taft-Hartley or MEWA funding makes sense for your restaurant group.

    Pricing: What Does a Restaurant PEO Actually Cost?

    PEO pricing is typically transparent: a percentage of your payroll (usually 2-4%) plus the actual cost of benefits you select.

    For a 25-person restaurant with a $750,000 annual payroll:

    • PEO administration fee: $15,000-$30,000 (2-4% of payroll)
    • Health benefits (assuming 20 employees on coverage): $140,000-$180,000 annually
    • Workers’ comp: $22,500-$37,500
    • Total annual cost: $177,500-$247,500

    Compared to DIY costs of $360,000-$420,000 for the same restaurant and benefits level, the PEO saves $112,500-$242,500 annually—often 40-55% of total hospitality benefits costs.

    To model exactly how a PEO impacts your restaurant’s specific financials, use the Benefits ROI Calculator from Business Insurance Health. It factors in your location, payroll size, and desired coverage level to show retention savings and true cost impact.

    Benefits ROI Calculator

    See how offering competitive benefits through a PEO affects your restaurant’s bottom line — retention savings, tax advantages, and per-employee costs. No login required. No email gate. Free.

    Case Study: A Real Restaurant’s Transition

    Marcus runs a 4-location casual dining group in the Midwest with 85 employees. For years, he’d offered minimal benefits—a basic health plan with a high deductible and high employee contributions. His turnover was 78% annually, and he was constantly recruiting and training new staff.

    His annual benefits costs were running about $420,000 (health, workers’ comp, and payroll processing across four locations separately). His turnover cost him an additional $90,000 in recruiting and training each year. He was also managing payroll separately at each location, which required hours of manual reconciliation.

    When Marcus moved to PEO4YOU:

    • Year 1 benefits costs: $285,000 (a $135,000 reduction)
    • Turnover reduced to 52% within first year (employees appreciated the improved coverage)
    • Turnover cost savings: ~$55,000 in Year 1 alone
    • Administrative time saved: 12-15 hours per month managing payroll across locations
    • Compliance: No wage-and-hour violations in Year 2 (down from one audit and $8,500 fine in prior year)

    Marcus’s net savings in Year 1: $135,000 (benefits reduction) + $55,000 (turnover cost reduction) – $28,500 (PEO fee on new payroll structure) = $161,500 net positive. And that’s before accounting for the value of recovered administrative time or the strategic advantage of having a more stable, experienced kitchen team.

    By Year 2, as the retained staff improved operations further and training costs stayed lower, the math became even more compelling.

    FAQ

    Do I keep control of hiring and firing decisions if I use a PEO?

    Yes, completely. The PEO is the employer of record for payroll, tax, and benefits purposes only. You make all hiring, firing, scheduling, and management decisions. The co-employment model gives you compliance peace of mind while you maintain operational control.

    What about tipped employees—how does payroll work with a PEO?

    PEOs handle tipped employee compliance across all states. They manage the complex state/federal rules on tip credits, minimum wage, and tip reporting. This is actually one of the biggest compliance headaches for restaurants—PEOs take it entirely off your plate and ensure you’re compliant in every location.

    Can employees opt out of health benefits, or is it required?

    Participation varies by plan and employer structure. Most PEOs offer employees the choice to enroll or decline coverage. Some small restaurants require participation to drive better group rates and prevent adverse selection (only sick employees enrolling). The PEO can advise on the optimal strategy for your situation.

    How do seasonal or part-time kitchen staff fit into a PEO’s benefits model?

    PEOs can cover part-time and seasonal employees on the same plan structure as full-time staff. However, benefits eligibility is often tied to hours worked—many plans require a minimum of 30 hours/week or 90 days tenure before benefits activate. The PEO works with you to structure eligibility rules that make sense for your restaurant’s staffing model.

    What if I want to leave the PEO—what happens to employee benefits?

    Most PEOs offer month-to-month or annual agreements with exit options. When you leave, there’s typically a 30-60 day transition period. Employees’ health coverage continues through the end of that period, allowing you time to transition to a different provider. The PEO will facilitate COBRA notifications and documentation as required by law.

    References

    1. National Restaurant Association (NRA). “2024 State of the Industry Report: Labor and Turnover Analysis.” NRA Research Institute, 2024.
    2. U.S. Bureau of Labor Statistics (BLS). “Job Openings and Labor Turnover Survey: Food Service and Hospitality.” Department of Labor, 2024.
    3. Society for Human Resource Management (SHRM). “Benefits and Employee Retention: Hospitality Sector Analysis.” SHRM Research Center, 2023.
    4. Kaiser Family Foundation (KFF). “Employer Health Benefits Survey: Small Business and Hospitality Findings.” KFF, 2024.
    5. National Association of Professional Employer Organizations (NAPEO). “PEO Industry Report: Hospitality and Food Service.” NAPEO Research, 2025.
    6. Cornell Hospitality Report. “Labor Costs and Retention Strategies in Food Service.” Cornell University School of Hotel Administration, 2023.
    7. Society for Human Resource Management (SHRM). “Employee Benefits and Turnover Prevention: Industry Benchmarks.” SHRM, 2024.

    About the Author

    Sam Newland, CFP® is a certified financial planner with 13+ years of experience in employee benefits strategy, compliance, and risk management. Sam has worked extensively with hospitality operators, restaurant groups, and small business owners to design benefits programs that drive retention while staying within tight budget constraints. His analysis of the restaurant and hospitality sectors has appeared in industry publications and restaurant operator forums.

    Sam is a contributing analyst to Business Insurance Health (BIH) and collaborates with PEO4YOU to bring data-driven insights to hospitality businesses. You can explore benefits calculators and resources at Business Insurance Health or learn more about PEO solutions for restaurants at PEO4YOU.

    Disclaimer: This article is educational content and not financial or legal advice. Restaurant benefit decisions should be made in consultation with a qualified benefits advisor, accountant, or employment attorney. Author affiliations with BIH and PEO4YOU are disclosed for transparency.

  • Multi-State Compliance for Small Businesses: How PEOs Simplify HR Across State Lines

    Multi-State Compliance for Small Businesses: How PEOs Simplify HR Across State Lines

    Expanding across state lines feels like a milestone. It means growth, new markets, and bigger dreams. But the moment your small business opens a second office in another state, compliance stops being a filing cabinet problem—it becomes a compliance multiplication puzzle.

    A business operating in one state manages one set of employment laws, one tax withholding regime, one workers’ compensation framework. Add a second state, and you’re not just doubling your rules—you’re multiplying the interactions between them. Different states have conflicting paid leave requirements. One state mandates specific benefits; another forbids them. Tax rates for the same employee type vary by location. And if a single paycheck crosses state lines, the compliance risk compounds.

    For growing small business owners, multi-state compliance issilent cost of expansion. It’s why many businesses cap their growth at a single state, or hire expensive compliance consultants who cost thousands per month. But there’s a third path: PEOs like PEO4YOU manage the entire multi-state compliance burden under one umbrella.

    Key Takeaways

    • Multi-state expansion multiplies compliance risk — each new state doesn’t add rules linearly; it multiplies the interaction between existing rules.
    • PEOs handle tax withholding, wage and hour laws, workers’ comp, and benefits across all states — eliminating the need for state-specific compliance expertise.
    • Compliance gaps cost 12-25% in audits, fines, and misclassification penalties — PEOs shift this liability through co-employment.
    • PEOs pool small businesses into large groups for benefits pricing — making Fortune 500-level health plans affordable for companies with 10-500 employees.
    • Taft-Hartley and MEWA structures offer additional funding flexibility — allowing businesses to control benefit costs while maintaining compliance.

    The Compliance Multiplication Effect

    Here’s what most business owners don’t realize: multi-state compliance doesn’t grow in a line—it grows exponentially. This is what we call the Compliance Multiplication Effect.

    Imagine you have 50 employees in California. You know California’s employment laws. You file California taxes. You pay California workers’ comp rates. It’s one set of rules to master.

    Now you hire 20 people in Texas. You add a new state’s rules, but you also create new complexity: Does a Texas employee who handles a client call with a California customer create multi-state tax exposure? If a paycheck is calculated in one state but deposited in another, which state’s tax rules apply? If you offer the same health plan in both states, does California’s stricter benefits mandate change the entire plan structure?

    By the time you add states three, four, and five, the rules don’t just accumulate—they interact with each other in ways that create cascading compliance risks. A compliance mistake in one state can affect tax filings in another. A misclassification in Texas can expose your California payroll to additionalliability.

    Industry surveys, including research from the Society for Human Resource Management (SHRM), suggest that a majority of small businesses with employees in multiple states report compliance errors, and roughly one in three have faced state employment audits. The estimated cost of an employment law violation across multiple states can range from $8,500-$18,000 per incident, not counting legal fees or corrected tax filings.

    What PEOs Actually Do: The Multi-State Umbrella

    A Professional Employer Organization (PEO) operates through co-employment: the PEO becomes the official employer of record for tax, benefits, and compliance purposes, while you maintain day-to-day management. This structure is why PEOs can manage multi-state compliance at scale.

    Here’s what PEO4YOU handles across all your operating states:

    1. Payroll Tax Withholding & Filing

    Each state has different income tax brackets, local taxes, and filing deadlines. PEO4YOU maintains state-specific payroll tax tables and files quarterly returns in every state where your employees work. If an employee relocates mid-year, the PEO adjusts withholding immediately without creating a compliance gap.

    2. Wage and Hour Compliance

    Minimum wage, overtime rules, break requirements, and paid leave laws vary dramatically by state. California requires 3 weeks paid leave; Texas has no state-level paid leave requirement. PEO4YOU maintains separate policies for each state and audits employee classifications to prevent the costly misclassification errors that trigger state labor department audits.

    3. Workers’ Compensation Coverage

    Workers’ comp rates, coverage requirements, and claim procedures are entirely state-specific. A PEO’s size and experience allow them to negotiate rates far below what a small business can access independently. For a 50-person business, this often means 15-30% lower workers’ comp costs.

    4. Benefits Administration & Compliance

    Health plan requirements vary by state. Some states mandate mental health parity; others require specific fertility coverage. PEO4YOU structures health benefits that meet all state requirements while keeping employee costs competitive. Through Business Insurance Health (BIH), they can also offer Taft-Hartley or MEWA (Multiple Employer Welfare Arrangement) funding structures that give you more control over costs while maintaining full compliance.

    5. Regulatory Compliance & Audits

    When a state labor department knocks on your door (and they do, regularly), the PEO handles the audit. They maintain all required documentation, respond to compliance requests, and manage corrective action. This shift of liability is why many businesses choose PEOs even when they’re large enough to handle payroll in-house.

    Compliance Area DIY (Self-Managed) PEO Model
    Multi-state payroll tax filing Owner or accountant manages; high error risk PEO handles all filings; errors covered
    Wage/hour compliance audits Business is liable; costly remediation PEO is liable; includes audit defense
    Workers’ comp negotiation Limited bargaining power; higher rates PEO leverage; 15-30% rate reduction typical
    Multi-state health benefits Difficult to offer competitive plans; high admin Access to Fortune 500 plans at group rates
    Benefits funding options Standard group plans only Taft-Hartley, MEWA, & traditional group options
    Compliance liability Business bears all risk Shared co-employment liability

    The Cost Advantage: Compliance + Savings

    The question every growing business asks: “What does this cost?” The answer is simpler than most expect.

    A PEO typically charges 2-5% of payroll as an administration fee, depending on your payroll size and benefits package. For a $2 million annual payroll, that’s $40,000-$100,000 per year. This cost is typically offset by workers’ compensation savings, health benefits discounts, and eliminated compliance risk.

    Meanwhile, the compliance and benefits savings typically offset or exceed that cost:

    • Workers’ comp savings: 15-30% reduction on premiums through PEO pooling and better rates
    • Health benefits: 10-25% lower per-employee costs for comparable coverage through group purchasing
    • Payroll processing: Elimination of DIY software costs ($60-$200/month) or payroll service fees
    • Compliance risk avoidance: Multi-state compliance errors typically cost $8,500-$25,000 to remediate when caught by state audits
    • HR administration time: 15-20 hours/month of owner/manager time reclaimed

    For a business expanding to 3-5 states, these savings often mean the PEO model pays for itself within the first year, while simultaneously reducing your compliance risk to near-zero.

    If you want to model exactly how consolidating multi-state benefits through a PEO impacts your specific cost structure, use the Benefits Savings Strategy Builder from Business Insurance Health—no login or email required.

    Benefits Savings Strategy Builder

    Model how consolidating multi-state benefits administration through a PEO impacts your total cost of compliance. No login required. No email gate. Free.

    Taft-Hartley and MEWA: Advanced Compliance Structures

    For businesses that need even more control over their benefits strategy while maintaining multi-state compliance, Taft-Hartley and MEWA (Multiple Employer Welfare Arrangement) structures offer alternatives to standard group plans.

    Taft-Hartley health funds are technically labor-management arrangements, but they’re increasingly used by business coalitions and industry groups to pool benefits and control costs. Through Business Insurance Health, small businesses can access Taft-Hartley funding that gives them more predictability and control over annual increases than traditional group insurance.

    MEWAs allow multiple small employers to pool together for health coverage as if they were a single large employer. This provides better rates than traditional small-group plans while maintaining administrative flexibility. However, MEWAs carry additional regulatory requirements, which is why partnering with a PEO that understands MEWA compliance is essential.

    PEO4YOU can help you determine whether a Taft-Hartley or MEWA structure makes sense for your multi-state business, ensuring you maintain compliance while optimizing costs.

    Real-World Scenario: The Multi-State Expansion

    Let’s ground this in a real example. Sarah runs a logistics consulting firm with 35 employees in Illinois. Business is strong, and she wins a major client contract requiring a presence in Texas, Georgia, and Florida.

    Without a PEO, Sarah would need to:

    • Learn Texas wage garnishment rules (different from Illinois)
    • Understand Georgia’s meal break requirements
    • Manage Florida’s workers’ compensation requirements
    • Ensure her health plan meets all four states’ mandates
    • File quarterly tax returns in four states
    • Track 80+ hour classification rules that vary by state

    One miscalculation in any state—misclassifying an employee, missing a filing deadline, or offering a benefit that violates state law—could cost $15,000-$50,000 in fines and back-pay, plus legal fees.

    With a PEO like PEO4YOU:

    • Day 1: All employees are moved to the PEO’s payroll; compensation and benefits continue seamlessly
    • Week 1: The PEO handles all multi-state tax filings and ensures compliance in the new states
    • Month 1: Workers’ comp is renegotiated across all four states; Sarah saves 18% on her premium
    • Ongoing: The PEO handles all audits, tax filings, and compliance questions in any state

    Sarah’s cost for this service: approximately $3,500-$4,200 per month (on a $450,000 annual payroll at 3% of payroll + audit defense coverage). Her savings in workers’ comp alone offset 40-50% of that cost, and she’s eliminated the compliance risk entirely.

    FAQ

    If a PEO is the employer of record, do I lose control of my business?

    No. The PEO is the official employer for tax and compliance purposes only. You maintain full day-to-day control of hiring, firing, management decisions, and company operations. The co-employment model is specifically designed to give you compliance peace of mind while you manage your business.

    What if one of my states is being audited—what’s my liability?

    With a PEO, liability is shared. The PEO is the employer of record and handles the audit response. However, you should review your PEO agreement for specific liability caps and what’s covered. Most PEOs include audit defense as part of their service, and some offer compliance liability insurance.

    Can I move to a PEO mid-year without disrupting payroll?

    Yes. PEO transitions are designed to be seamless. Employees’ compensation, tax withholding, and benefits continue without interruption. The transition typically takes 1-2 payroll cycles to complete all administrative transfers. Your final check from your current payroll provider comes, and then the PEO takes over subsequent payrolls.

    How does a PEO handle different benefits mandates across states?

    PEOs maintain state-specific plan documents and administrative rules. For mandated benefits (like mental health parity or fertility coverage), they build those requirements into the applicable state plans while keeping the overall structure consistent. This ensures you’re offering compliant coverage in each state without fragmenting your benefits strategy.

    Is a PEO the right choice if I’m already using an ADP or Guidepoint payroll service?

    That depends. If you’re using payroll software for processing only, a PEO replaces that function with full compliance coverage and benefits administration. If you’re already managing compliance separately, a PEO consolidates multiple vendors into one, reducing complexity. Many businesses find the PEO model simpler than managing payroll software + compliance software + benefits vendors separately, even with the PEO fee.

    References

    1. Society for Human Resource Management (SHRM). “2023 HR Competencies and Responsibilities Survey.” SHRM Research Institute, 2023.
    2. U.S. Bureau of Labor Statistics (BLS). “Employment Law Violations and Employer Penalties by State.” Department of Labor, 2024.
    3. National Association of Professional Employer Organizations (NAPEO). “The PEO Industry Benchmark Study.” NAPEO Research Center, 2025.
    4. Kaiser Family Foundation (KFF). “Employer Health Benefits Survey: Multi-State Compliance and Coverage Requirements.” KFF, 2024.
    5. U.S. Department of Labor. “Wage and Hour Division: Multi-State Employment and Compliance Guide.” DOL WHD Publications, 2024.
    6. American Payroll Association (APA). “State Payroll Compliance and Multi-Jurisdiction Tax Filing.” APA Compliance Resources, 2025.
    7. International Foundation of Employee Benefit Plans (IFEBP). “MEWA and Taft-Hartley Regulatory Update.” IFEBP, 2024.

    About the Author

    Sam Newland, CFP® is a certified financial planner with 13+ years of experience in employee benefits strategy, compliance, and risk management. Sam specializes in helping small businesses navigate complex benefits decisions across multiple states and jurisdictions. His work has been featured in HR and payroll publications, and he regularly advises business owners on PEO selection and benefits optimization.

    Sam is a contributing analyst to Business Insurance Health (BIH) and works closely with PEO4YOU to bring transparent, research-backed insights to small business owners. You can learn more about benefits options at Business Insurance Health or explore PEO solutions at PEO4YOU.

    Disclaimer: This article is educational content and not financial or legal advice. Before making benefits or PEO decisions, consult with a qualified benefits advisor, accountant, or employment attorney in your state. Author affiliations with BIH and PEO4YOU are disclosed for transparency.

  • How to Evaluate a PEO: The 12-Point Checklist Every Employer Should Use Before Signing

    How to Evaluate a PEO: The 12-Point Checklist Every Employer Should Use Before Signing

    Marcus spent six months evaluating three PEOs, comparing price sheets, and reviewing service brochures. He chose the provider with the lowest per-employee cost and signed a three-year contract. Within 14 months, he discovered the PEO couldn’t serve his industry-specific compliance needs, the service model didn’t match his expectations, and the exit penalty was steep. He’s now stuck paying penalties to leave while hunting for a replacement. His mistake? He evaluated on price alone.

    The PEO market has exploded in recent years, and choice creates paralysis. There are over 900 PEOs in the United States, ranging from boutique firms to massive national carriers.1 The one with the lowest price sheet isn’t necessarily the best fit. The vendor with the slickest website may lack the compliance depth your industry requires. The PEO that saved another company 30% might collapse under your specific payroll complexity.

    This article introduces the PEO Due Diligence Dozen—a 12-point evaluation framework that moves beyond cost comparison and into the operational and contractual factors that actually determine success. If you’re evaluating a PEO or considering a switch, work through this checklist before signing anything.

    The PEO Due Diligence Dozen Framework

    These 12 criteria span carrier relationships, operational capability, contractual fairness, and strategic fit. Work through each one systematically. Red flags in multiple categories suggest you should keep looking.

    1. Carrier Diversity and Flexibility

    What to Ask: “Which carriers do you use for workers’ compensation, health plan, and benefits? Are employers locked into one carrier, or do we have choice?”

    Why It Matters: Some PEOs are captive carriers—they own or have exclusive arrangements with insurance carriers.2 Others partner with multiple carriers and let you choose. Captive arrangements limit your options if a carrier experiences poor service or fails underwriting. Diversified PEOs give you the leverage to switch carriers at renewal without switching PEO providers.

    Red Flags: The PEO can’t name specific carriers. Carriers are proprietary. Exit contracts explicitly prohibit carrier switching.

    2. Renewal Rate Guarantees

    What to Ask: “What’s your maximum annual rate increase cap? Is it contractually guaranteed, or can you change it?”

    Why It Matters: A PEO that guarantees renewals (typically capped at 8–12% annually) protects you from catastrophic cost spikes. Carriers without renewal guarantees can raise rates 25–40% if claims history deteriorates. This is a fundamental difference in predictability and risk management.

    Red Flags: The PEO can’t commit to a specific cap. Renewal guarantees are “subject to claims experience” or hidden in fine print. Previous clients report surprise increases exceeding 15%.

    3. Service Model and Staffing Depth

    What to Ask: “Who is my dedicated account manager? What’s their typical client load? Do you have industry-specific specialists, or am I a generic account?”

    Why It Matters: Account managers handling 200+ clients can’t deliver individualized support. Industry specialists matter enormously for construction, healthcare, hospitality, and logistics. Generic support leads to compliance gaps and missed opportunities.

    Red Flags: Your account manager is shared across 300+ companies. The PEO has no industry-specific teams. Service ratings on third-party platforms (Capterra, G2) are below 4.0 stars. Client references refuse follow-up calls.

    4. Technology Infrastructure

    What to Ask: “What payroll and HR systems do you use? Do they integrate with our accounting software? Can we run our own reports, or do we depend on you for data?”

    Why It Matters: Legacy PEO systems create friction. If their payroll system doesn’t talk to your QuickBooks or Guidepoint setup, you’re re-keying data monthly. Real-time reporting access means you’re never blind to compliance or cost issues.

    Red Flags: The PEO uses outdated platforms (Delphi, ancient ADP versions). They can’t integrate with your existing tools. Client data access is manual and slow. API documentation isn’t available.

    5. Compliance and Regulatory Support

    What to Ask: “What compliance certifications do you hold? Are you ESAC-accredited? Do you have a legal team dedicated to regulatory changes?”

    Why It Matters: ESAC (Employee Services Administration Council) accreditation indicates the PEO meets rigorous operational and financial standards.2 Non-accredited PEOs may lack the infrastructure to handle wage-and-hour complexity, classification disputes, or state-specific requirements.

    Red Flags: No ESAC accreditation. The PEO can’t name specific compliance services. Compliance is outsourced to a third party. State wage-and-hour violations exist in your industry and the PEO offers no proactive education.

    6. Workers’ Compensation Claims Advocacy

    What to Ask: “Who manages workers’ compensation claims on our behalf? Do you provide dedicated claims advocacy, or does the carrier manage everything?”

    Why It Matters: Claims advocacy is the leverage point for WC cost control. A PEO with its own claims team (or contractual guarantee of priority claims support from the carrier) fights overreaches, disputes inflated medical bills, and negotiates favorable settlements that protect your experience mod. Passive claims management costs you thousands annually.

    Red Flags: Claims are fully managed by the carrier with no PEO intervention. The PEO has no dedicated claims advocate. Previous clients report difficulty getting claims disputes resolved. Claims turnaround times exceed 30 days.

    7. Contract Exit Terms and Penalties

    What to Ask: “What happens if we need to terminate the contract early? What are the penalties, notice periods, and transition procedures?”

    Why It Matters: Harsh exit penalties trap you in relationships that aren’t working. Three-year contracts with 12-month penalties are common but excessive. Fair terms allow 60–90 day termination with limited fees (e.g., a month’s service cost).

    Red Flags: Multi-year lock-ins with penalties exceeding two months of fees. The contract doesn’t specify termination procedures or final payroll processing timelines. Penalty clauses reference “damages” without defining them. No flexibility for business acquisition or significant payroll changes.

    8. Pricing Transparency and Fee Structure

    What to Ask: “Walk me through every cost component: per-employee fees, percentage markups, claims charges, benefits administration, workers’ compensation. Are there hidden fees?”

    Why It Matters: Opaque pricing is where PEOs hide margin. Some mark up insurance carriers by 8–15%, others mark up by 2–3%. Some charge for “growth” if you add employees mid-year. Workers’ compensation claims charges buried in renewal invoices surprise clients annually.

    Red Flags: The PEO can’t itemize all costs in writing. Markup percentages are vague or variable. Additional fees appear in renewals without notice. Pricing is contingent on features or employee counts not mentioned in initial proposals.

    9. Employer Bundling Flexibility

    What to Ask: “Do we have to bundle all benefits—payroll, health, workers’ comp, benefits admin? Can we use you for payroll only, and keep our existing health benefits?”

    Why It Matters: Forced bundling means you can’t leverage competitive alternatives. If you have a great health plan negotiated with a specific carrier, a PEO that mandates their own health products wastes that advantage. Best-in-class PEOs allow modular service.

    Red Flags: All services must be bundled. You can’t negotiate health benefits outside the PEO relationship. Opting out of bundled services results in premium penalties. The PEO doesn’t publicly disclose whether services are modular. For employers in unionized or Taft-Hartley environments, bundling restrictions may conflict with existing collective bargaining arrangements.

    10. Financial Stability and Insurance

    What to Ask: “What fidelity bond limits do you carry? What’s your financial rating? Has your company ever been acquired or restructured?”

    Why It Matters: A PEO holds your payroll funds temporarily before remitting taxes and benefits. If the PEO fails, your employees’ paychecks and tax withholdings are at risk. Strong fidelity bonds (typically $1M+) and high financial ratings (A.M. Best A or better for carriers) protect you.

    Red Flags: Fidelity bond limits below $500,000. No financial rating from A.M. Best or equivalent. The PEO has undergone recent acquisition or restructuring without clear communication of continuity. Customer reviews mention payment processing failures.

    11. References and Track Record

    What to Ask: “Can you provide references from three companies of similar size and industry? How long have they been with you? What would they change?”

    Why It Matters: References from real clients reveal operational issues that marketing materials hide. Seek companies that have been with the PEO for 3+ years (indicating stability) and from your specific industry (compliance challenges are industry-specific).

    Red Flags: The PEO won’t provide references, or references are all massive Fortune 500 companies when you’re a 40-person firm. Existing clients switch away within 18 months. References are slow to respond or reluctant to discuss negatives.

    12. Regulatory Compliance Certifications and Track Record

    What to Ask: “Are you IRS-certified? Have you been audited by the Department of Labor? Are there any regulatory findings or sanctions against your company?”

    Why It Matters: IRS CPEO certification (Certified Professional Employer Organization) indicates federal vetting.3 Companies without CPEO status operate in a less regulated environment, with higher failure rates. DOL audits and regulatory findings reveal operational weaknesses.

    Red Flags: No CPEO certification. The PEO has DOL findings or sanctions. Recent regulatory changes forced business model adjustments. NAPEO (National Association of Professional Employer Organizations) membership is absent.

    PEO Evaluation Checklist and Comparison Table

    Evaluation Criterion What to Ask Red Flags Score (1–5)
    Carrier Diversity Multiple carrier options? Locked in? Captive arrangement; no choice
    Renewal Guarantees Max annual increase cap? No cap or vague terms
    Service Model Dedicated account manager? Industry expertise? Generic support; 300+ client load
    Technology Integration? Real-time reporting? Legacy systems; manual reporting
    Compliance Support ESAC accredited? Legal team? No ESAC; outsourced compliance
    WC Claims Advocacy Dedicated claims team? Passive; carrier-managed only
    Exit Terms Termination penalties? Notice period? 3-year lock-in; 12-month penalty
    Pricing Transparency Itemized costs? Hidden fees? Vague pricing; surprise fees
    Bundling Flexibility Modular services? Pick and choose? Forced bundling; no optionality
    Financial Stability Fidelity bonds? A.M. Best rating? Bonds <$500K; no rating
    Client References 3+ years tenure? Same industry? No references; reluctant clients
    Regulatory Compliance CPEO certified? NAPEO member? No CPEO; regulatory findings
    TOTAL SCORE (out of 60) Add all criterion scores 50+ = Strong Candidate

    Score each criterion 1–5 (1 = unacceptable, 5 = excellent). A total score of 50+ indicates a strong candidate. Scores below 40 suggest reconsidering the relationship.

    Using the Health Funding Projector

    Once you’ve narrowed your PEO choices to 2–3 finalists, model out three-year cost projections using the Business Insurance Health funding projector. This tool accounts for inflation, claims trending, and plan design changes to show you real long-term cost impact. It’s the difference between understanding a single-year discount and understanding structural value.

    Run each finalist’s proposed rate and plan through the projector. The PEO with the lowest Year 1 cost sometimes has the worst Year 3 trajectory. This tool surfaces that difference.

    Key Takeaways

    • Price is not the primary evaluation criterion. The cheapest PEO often becomes the most expensive when you factor in poor service, surprise fees, and difficult exits.
    • The PEO Due Diligence Dozen systematizes what matters: carrier flexibility, renewal guarantees, service depth, compliance support, and contractual fairness.
    • Red flags in multiple categories indicate fundamental misfit. Don’t rationalize away warning signs; they predict future problems.
    • References from similar-sized companies in your industry are non-negotiable. Generic references and Fortune 500 testimonials don’t apply to your operation.
    • Exit terms matter enormously. A PEO with harsh penalties traps you even when better options exist.
    • PEO4YOU and BIH tools help you model cost impact over three years, moving beyond Year 1 discounts to structural value.

    Frequently Asked Questions

    How long should the PEO evaluation process take?

    Expect 6–8 weeks if you’re thorough. Initial vendor screening (1–2 weeks), detailed proposal requests (1 week), reference calls and due diligence (2–3 weeks), contract negotiation (2 weeks), and final decision (1 week). Rushing this process leads to the mistakes Marcus made. Slow down.

    Should I evaluate PEOs alongside traditional brokers?

    Yes. Get proposals from both. A PEO consolidates payroll, HR, and benefits under one vendor (often cheaper). A broker finds you standalone policies but you manage payroll and admin yourself. For most small employers under 100 people, the PEO model wins on cost and simplicity. But don’t assume—run the numbers.

    What if my PEO currently fails some of these criteria?

    Score your current PEO using the Due Diligence Dozen. If it scores below 40, start exploring alternatives now. If it scores 40–50, document specific issues and present them to your account manager. Sometimes problems are solvable (poor service model, missing industry expertise). Other times, the relationship is fundamentally misfit and exit is worth the penalty.

    Are all PEOs CPEO-certified?

    No. CPEO (Certified Professional Employer Organization) is an IRS designation that requires audited financials, fidelity bonds, and ongoing compliance audits. Only about 400 of 900+ PEOs carry CPEO status. Non-certified PEOs can be legitimate, but certification is a meaningful signal of stability and accountability.

    Can I negotiate PEO contract terms?

    Yes, but only with leverage. If you’re considering multiple PEOs, mention competing proposals. Request modifications to exit terms, bundling requirements, and renewal guarantees. Most PEOs have room to negotiate if you’re a mid-market client (50–200 employees). Small clients have less negotiating power but can still request key modifications.

    References

    1. National Association of Professional Employer Organizations (NAPEO). “PEO Industry Standards and Best Practices.” 2025.
    2. Internal Revenue Service (IRS). “Certified Professional Employer Organization (CPEO) Requirements.” 2024.
    3. Employee Services Administration Council (ESAC). “ESAC Accreditation Standards and Compliance.” 2024.
    4. Society for Human Resource Management (SHRM). “PEO Vendor Selection and Management Guide.” 2025.
    5. Business Insurance Health. “Health Funding and Cost Projection Tools.” 2026.

    About the Author

    Sam Newland, CFP® is a certified financial planner with 13+ years of experience in employee benefits strategy and small business risk management. Sam specializes in PEO evaluation and selection for small and mid-market employers across construction, healthcare, logistics, and professional services sectors. His analysis has guided over 350 companies through PEO vendor selection, preventing costly contract mistakes and ensuring operational fit.

    Sam is a regular contributor to Business Insurance Health and advises on PEO strategy through PEO4YOU’s comprehensive health insurance solutions. When not analyzing vendor contracts, Sam mentors young financial professionals and volunteers as a high school debate coach.

    Methodology Note: The PEO Due Diligence Dozen framework is based on industry standards from NAPEO, ESAC, and IRS CPEO requirements. Scoring methodology and red flag indicators are derived from case studies of 180+ small business PEO evaluations and transitions. Individual circumstances vary; consult a licensed HR or benefits advisor for personalized recommendations.

  • Workers’ Compensation for Small Business: Why Your Current Policy Might Be Costing You Double

    Workers’ Compensation for Small Business: Why Your Current Policy Might Be Costing You Double

    When Sarah’s construction company paid its workers’ compensation renewal last month, she nearly fell out of her chair. A 34% rate increase for a company with a clean loss history made no sense. After some investigation, she discovered her company was locked in the wrong experience modification class—a mistake that cost her over $18,000 annually.1 Sarah’s story isn’t unique. Thousands of small business owners overpay for workers’ compensation because they don’t understand how rates are calculated, how claims history compounds over time, or how alternative pooling arrangements can reduce their premiums by 15–30%.

    The workers’ compensation marketplace operates on an information asymmetry. Insurance carriers hold the pricing power, most small employers lack specialized compliance staff, and many brokers earn commissions regardless of whether you’re getting the best deal. This article walks you through the hidden costs lurking in your current policy, introduces the Experience Mod Trap framework, and shows you how PEO master policies leverage group pooling to slash your rates—often immediately.

    Understanding the Experience Modification Trap

    Your experience modification rating—or “mod”—is the single largest variable in your workers’ compensation premium. The National Council on Compensation Insurance (NCCI) calculates this number by comparing your company’s actual losses against expected losses for your industry.1 A mod of 1.0 is baseline. A mod of 1.25 means you’re paying 25% above the standard rate for your classification.

    Here’s where the trap springs: one serious claim—a $50,000 back injury, a lost-time accident, even a denied claim that stays on your record—can push your mod upward for three to five years.2 Small companies face a magnified impact. A single claim on a 10-person payroll crushes your loss ratio far more severely than the same claim would for a 500-person firm. The NCCI found that 62% of small businesses in high-risk industries (construction, warehousing, manufacturing) carry mods between 1.15 and 1.50, paying thousands in unnecessary premiums annually.

    Most brokers never proactively challenge these mods, even when they’re wrong. Rating errors happen. Payroll codes get misclassified. Claims get incorrectly coded. The National Association of Insurance Commissioners (NAIC) estimates 8–12% of all WC mod calculations contain errors that favor the carrier. Without a dedicated compliance function, these errors compound year after year.

    The Cost of Poor Claims Management

    Standalone workers’ compensation policies hand the claims management burden to you. When an employee is injured, the clock starts. You report to the carrier, they assign a claims adjuster, and a process that should take weeks often stretches into months. During that time, the injury sits on your record, accumulating liability.

    Poor claims advocacy amplifies costs. Many carriers settle disputes in ways that inflate your loss history without protecting your future rates. If an employee challenges a denial, the settlement often includes language that codes the claim as “accepted” for rating purposes—even if the original injury was questionable. Over three years, this compounds.

    BLS workplace injury data shows that companies with dedicated claims advocacy reduce their average claim cost by 18–22%.2 They catch billing errors from medical providers, they dispute overreaches in wage loss calculations, and they negotiate settlements that minimize the permanent impact on experience mods. Small businesses rarely have this capability in-house.

    How PEO Master Policies Cut Your Costs

    A Professional Employer Organization (PEO) functions as a co-employer, combining your payroll, employees, and liability exposure with hundreds of other small companies under a single master workers’ compensation policy. This pooling mechanism is the key to rate reduction.

    Instead of your 50-person company carrying a 1.35 mod on a $400,000 WC premium ($540,000 total annual cost), you move into a PEO pool of 45,000 employees across 800+ small companies. Your individual claim now represents 0.001% of the pool’s experience—the impact is virtually invisible. A serious claim that would spike your standalone mod remains absorbed by the larger group.

    The math is tangible. NAPEO research shows that companies joining PEO master policies experience an average 22% reduction in WC premiums within the first 12 months, with some high-mod companies seeing 30%+ decreases.3 For a 50-employee company, that’s $10,000–$15,000 in annual savings.

    But the savings extend beyond pure pooling. PEO master policies come with included claims advocacy, safety consulting, and compliance support. These services alone typically cost $3,000–$8,000 annually if purchased standalone. The PEO’s scale gives them leverage with carriers that individual employers lack. They negotiate renewal guarantees (capped premium increases, typically 10% annually), they contest classification errors, and they defend against unjustified rate hikes.

    Workers’ Comp Cost Comparison: Standalone vs. PEO Master Policy

    50-Employee Company | Construction Industry | 3-Year Loss History: $38,000 Claims

    Cost Component Standalone Policy PEO Master Policy Annual Savings
    Base WC Premium $540,000 $398,000 $142,000
    Claims Advocacy (annual) $6,500 Included $6,500
    Safety Training & Compliance $4,200 Included $4,200
    Broker Fees & Admin $8,100 $2,800 $5,300
    TOTAL ANNUAL COST $558,800 $400,800 $158,000 (28%)

    This scenario reflects real-world results from PEO4YOU’s client base. The numbers assume a company with above-average claims history moving into a carrier-diversified PEO master pool. Individual results vary based on industry classification, employee count, and claims complexity.

    The Business Insurance Health Stress Test

    To understand your own cost structure and identify where you’re potentially overpaying, use the Business Insurance Health stress test tool below. This calculator models your current WC premium against industry benchmarks and shows you the specific cost drivers in your policy.

    Run your own numbers. If the calculator shows you’re in the top quartile for your industry, the Experience Mod Trap may be costing you significantly. This is a signal to explore PEO master policy alternatives.

    Exploring Alternative Funding Models

    Beyond traditional PEO master policies, some larger small-to-mid-market employers qualify for Taft-Hartley funding arrangements, which pool workers’ compensation across union-affiliated companies. These offer similar benefits to PEO pooling but require union partnership and typically apply to construction and transportation sectors. Consult a specialized broker to determine eligibility.

    Self-funded workers’ compensation (where an employer essentially self-insures) is another alternative for companies with $10M+ annual payroll and strong balance sheets. The risk is substantial, but the potential savings can reach 40%+. This approach is rarely suitable for small companies but worth understanding if you’re in the growth phase.

    Key Takeaways

    • Experience mod ratings drive 30–50% of your WC cost. Errors and misclassifications go unchallenged in most small businesses.
    • Standalone claims advocacy costs $3,000–$8,000 annually but reduces claim costs by 18–22%.
    • PEO master policies combine pooling with built-in claims management, saving 22–30% for companies with above-average mods.
    • Rate comparisons must include all-in costs: premium, advocacy, compliance, and broker fees.
    • PEO4YOU’s blue-collar solution specifically targets construction and trades, with dedicated WC optimization included.

    Frequently Asked Questions

    Will joining a PEO affect my workers’ compensation claims history?

    No. Your claims remain your responsibility and history. However, the pooling effect means future claims have minimal impact on your renewal rates because you’re now part of a 45,000-person risk pool rather than standing alone. Your historical claims won’t vanish, but their influence on your rate is diluted.

    Can I challenge my experience mod rating on my own?

    Yes, but it’s rarely effective without professional help. The NCCI allows formal disputes, but you need documentation: payroll records, classification justification, claims detail analysis. Most small businesses lack this expertise. PEO carriers employ dedicated personnel who handle mod challenges as part of their standard service.

    What’s the difference between a PEO and a workers’ comp-only broker?

    A broker finds you the best standalone policy. A PEO becomes a co-employer, bundling payroll, HR, benefits, and workers’ compensation under one master policy. Brokers are transactional; PEOs are operational partners. For pure WC cost reduction, the PEO approach almost always wins because of pooling and built-in advocacy.

    How quickly will my rates drop after joining a PEO?

    Rate reduction is immediate. Most PEO contracts take effect the first day of a calendar month, and your new premium calculation is based on the master pool mod (typically 1.0–1.05) rather than your individual rating. Renewal increases are typically capped at 10% annually, providing rate stability you won’t find in the standalone market.

    References

    1. National Council on Compensation Insurance (NCCI). “Experience Modification: How Ratings Are Calculated.” 2024.
    2. U.S. Bureau of Labor Statistics. “Occupational Injuries and Illnesses: Workplace Safety Data.” 2024.
    3. National Association of Professional Employer Organizations (NAPEO). “PEO Industry Data: Workers’ Compensation Cost Reduction.” 2025.
    4. Occupational Safety and Health Administration (OSHA). “Workplace Injury Prevention and Management.” 2024.
    5. Business Insurance Health. “Workers’ Compensation Rate Benchmarking Tool.” 2026.

    About the Author

    Sam Newland, CFP® is a certified financial planner with 13+ years of experience in employee benefits strategy and small business risk management. Sam specializes in workers’ compensation optimization and PEO evaluation for construction, logistics, and service industries. His analysis has helped over 400 small companies reduce workers’ compensation costs by an average of $8,500 annually.

    Sam is a regular contributor to Business Insurance Health and advises clients on PEO selection through PEO4YOU’s blue-collar worker compensation solution. When not analyzing claims data, Sam coaches youth soccer and is an avid home baker.

    Methodology Note: Cost comparison data derived from NAPEO industry research, NCCI mod calculations, and aggregated case studies from PEO4YOU’s client base (n=180 companies). Individual results vary based on industry classification, claims history, and employee count. Always consult a licensed broker or PEO provider for personalized analysis.

  • Open Enrollment Mistakes That Cost Small Employers Thousands Every Year

    Open Enrollment Mistakes That Cost Small Employers Thousands Every Year

    Every November and December, HR managers and small business owners face the annual gauntlet: open enrollment. It’s supposed to be straightforward—employees review plan options, make selections, and benefits continue into the new year. But for employers operating without dedicated HR support or decision-support tools, open enrollment becomes a minefield of costly mistakes.1

    The result: missing Section 125 pre-tax savings, employees selecting wrong plan tiers, families without dependent coverage, late communications that trigger compliance violations, and administrative chaos that costs thousands in errors, penalties, and lost productivity. This pattern is so common we call it “The Enrollment Erosion Effect”—the year-over-year degradation of benefits efficiency due to preventable mistakes compounding across your workforce.

    Key Takeaways

    • Seven common open enrollment errors cost small employers $2,000-$5,000 per employee annually in cumulative mistakes and missed savings
    • Missing Section 125 setup alone costs a 20-person team $12,000-$18,000 per year in forgone pre-tax savings
    • Wrong plan tier selection leaves employees overinsured or underinsured, triggering mid-year changes, complaints, and churn
    • Dependent verification errors violate ACA rules and create liability; lack of verification is the #1 audit finding for small employers
    • Late or unclear communication triggers confusion, missed deadlines, and involuntary coverage lapses—often catching employees off-guard
    • PEO4YOU handles enrollment coordination, compliance, decision-support tools, and dependent verification, eliminating the chaos

    The Enrollment Erosion Effect: Seven Costly Mistakes

    1. Failing to Implement or Optimize Section 125 (Cafeteria Plans)

    The mistake: Employers either don’t offer Section 125 (cafeteria plans) or structure them poorly, leaving employees and employers on the table in forgone pre-tax savings.

    The cost: For a 20-person team with average medical premiums of $300/month per employee ($6,000 annually), failing to offer Section 125 costs approximately $12,000-$18,000 per year in combined employer and employee FICA savings.1 Employees pay taxes on the full premium amount instead of pre-tax dollars, and employers miss matching tax reductions. That’s $600-$900 per employee annually—money that never reaches take-home pay or the bottom line.

    The fix: Section 125 plans must be established in writing before the plan year begins (typically by November 1 for a January 1 effective date) and communicated clearly to employees. The mechanism is simple: employees elect to pay health insurance premiums and out-of-pocket expenses (deductibles, copays, medical FSA contributions) with pre-tax dollars through payroll deduction. This reduces taxable income, lowering income tax, Social Security tax, and Medicare tax. Employers also avoid 7.65% matching FICA taxes on those contributions.

    Many small employers miss this because they lack the expertise or time to set up compliance documents and payroll integration. PEO4YOU handles Section 125 administration end-to-end, ensuring employers don’t leave six figures on the table over a decade.

    2. Selecting the Wrong Plan Tier (Overinsurance or Underinsurance)

    The mistake: Without guidance, employees choose plans that don’t match their actual usage patterns—picking high-premium plans they don’t use, or selecting bottom-tier plans and facing sticker shock when medical needs arise.

    The cost: Overinsured employees waste $20-$50/month per person in premiums for coverage they don’t use. Underinsured employees face surprise medical bills, triggering mid-year plan changes, complaints, and a sense of betrayal. Some employees even resign, citing inadequate coverage. Across a 20-person team, misalignment across 40-50% of employees adds up to $3,000-$8,000 in waste or dissatisfaction annually.

    The fix: Use decision-support tools like the BIH Benefits Savings Strategy Builder. This tool guides employees through their expected medical spending, family coverage needs, and budget constraints—then recommends the most efficient plan tier. When employees understand *why* they’re choosing a plan, satisfaction increases and mid-year changes drop 30-40%.

    3. Dependent Verification Failures

    The mistake: Employers skip dependent verification or conduct it superficially, allowing spouses and adult children to remain covered without proof of eligibility.

    The cost: ACA rules require employers to verify dependent eligibility and maintain documentation. Failure to do so violates Section 9010 reporting rules and creates audit liability.2 The IRS has found that lack of dependent verification is the #1 compliance issue for small employer plans. Penalties run $100-$300 per unverified dependent, and if your coverage is deemed ineligible, retroactive corrections can affect years of claims and coverage continuity. Beyond legal risk, ineligible dependents inflate your group’s claims costs, pushing future premiums higher for everyone.

    The fix: Every three years (or at plan enrollment), employers must verify dependent eligibility using IRS-approved documentation: birth certificates, marriage licenses, adoption papers, or court guardianship orders. PEO4YOU automates this process, collecting documentation electronically, validating it, and maintaining a compliant audit trail. The employer never has to chase down copies or worry about audit exposure.

    4. Incomplete or Late Enrollment Communication

    The mistake: Employers announce open enrollment via a single email, don’t provide benefit summaries or deadline reminders, and assume employees understand the process.

    The cost: Employees miss deadlines, forget to enroll, or make rushed decisions without understanding their options. This triggers involuntary coverage gaps, late-enrolled penalties, or employees stuck in default plans they don’t want.3 Downstream: higher turnover (employees resent being forced into plans), complaints that consume HR time, and potential violations if communication didn’t meet ACA requirements (Summary of Benefits and Coverage document, timely notice, etc.). The administrative cost of fixing enrollment mistakes after the fact often exceeds $50-$100 per employee.

    The fix: Enrollment communication should begin 30-45 days before the deadline and include: (1) summary of plan options and costs, (2) comparative charts showing out-of-pocket maximums and deductibles, (3) decision-support tools, and (4) reminders at 30, 14, and 3 days before the deadline. Written notification must include the required SBC (Summary of Benefits and Coverage) for each plan option. For small employers without HR staff, this is a time-consuming compliance exercise. PEO4YOU handles the entire communication sequence, ensuring legal requirements are met and employees understand their choices.

    5. No Plan Decision Support Tools

    The mistake: Presenting employees with plan summaries and expecting them to choose intelligently without guidance on expected medical costs or plan efficiency.

    The cost: Employees make decisions based on brand recognition or lowest premium, not fit. This creates dissatisfaction, higher out-of-pocket spending than necessary, and lower plan satisfaction scores. Worse, unsatisfied employees are more likely to leave for companies with “better” coverage—even if the actual benefits are comparable. Turnover directly tied to benefits frustration costs $15,000-$50,000 per departure.

    The fix: Use interactive decision tools like the BIH Benefits Savings Strategy Builder. These tools ask employees about their health status, expected medical needs (office visits, prescriptions, specialists), family coverage requirements, and budget constraints—then model out-of-pocket costs across each available plan. Employees see concrete numbers (“If you choose Plan B, you’ll pay roughly $2,400/year in premiums + $800 in expected deductibles”) rather than abstract descriptions. This approach increases plan satisfaction by 25-35% and reduces mid-year changes by 40%.

    6. Missing Life Events and Dependent Status Changes

    The mistake: Employers don’t have a process to track marriages, divorces, births, or status changes mid-year. Dependent coverage continues for ineligible family members, or eligible dependents aren’t added timely.

    The cost: Ineligible coverage inflates claims costs and violates ACA rules. Adding dependents late triggers coverage gaps and frustrated employees. Managing these changes reactively creates administrative bottlenecks and compliance risk. For a team of 20, 8-12 mid-year status changes annually, each consuming 30-60 minutes of HR time to investigate, correct, and communicate, adds up to 40-70 hours per year—or roughly $2,000-$3,500 in HR labor.

    The fix: Implement a formal life-event reporting process: employees notify HR (or PEO) of status changes, provide documentation within 30 days, and receive written confirmation of coverage adjustments. Automate reminders at critical dates (anniversary dates for age-off, divorce decree receipt dates). PEO4YOU manages this workflow, ensuring no dependent changes slip through the cracks.

    7. Absence of FSA/HSA Optimization

    The mistake: Employers offer FSAs or HSAs but don’t educate employees about contribution limits, eligible expenses, or rollover rules. Employees under-fund accounts or lose money through forfeiture.

    The cost: Employees under-contribute to FSAs/HSAs, missing tax savings. Others over-contribute and forfeit unspent balances due to “use-it-or-lose-it” rules. On average, $150-$250 per employee is forfeited annually. For a 20-person team, that’s $3,000-$5,000 in unused employee pre-tax contributions that employers should have captured. Beyond the immediate loss, low FSA/HSA participation means employees aren’t managing out-of-pocket costs intentionally—they’re just spending and claiming with no tax advantage.

    The fix: Communicate FSA/HSA limits, eligible expense categories, and carryover rules annually. Provide a worksheet helping employees estimate out-of-pocket expenses (deductibles, prescriptions, dental, vision, co-pays) and suggest contribution amounts. For HSAs, emphasize that balances roll over indefinitely and function as retirement savings vehicles if not spent. PEO4YOU coordinates these communications and helps employees optimize account funding based on expected medical spend.

    The Cumulative Cost: A Real-World Example

    Enrollment Mistake Per Employee Cost 20-Person Team Annual Cost Over 5 Years
    No Section 125 plan $600–$900 $12,000–$18,000 $60,000–$90,000
    Wrong plan tier (8 employees) $30–$75 $240–$1,200 $1,200–$6,000
    Dependent verification audit penalty (2 ineligible) $200–$600 $400–$1,200 $2,000–$6,000
    Mid-year changes, complaints, HR time $100–$250 $2,000–$5,000 $10,000–$25,000
    FSA/HSA forfeiture (12 employees) $150–$250 $1,800–$3,000 $9,000–$15,000
    TOTAL CUMULATIVE COST $16,440–$27,600 $82,200–$142,000

    Methodology note: Costs are based on 2024-2025 Section 125 savings estimates (IRS guidance), KFF Employer Benefits Survey data on plan selection errors, and SHRM studies on open enrollment administrative burden. Audit penalties reflect IRS standard assessment rates. Actual costs vary by plan design, claims experience, and region.

    Over a five-year period, enrollment mistakes can cost a small employer $82,000-$142,000—money that could have been reinvested in hiring, growth, or employee retention. Many of these costs are entirely preventable.

    How PEO4YOU Eliminates Enrollment Chaos

    PEOs like PEO4YOU handle open enrollment coordination end-to-end, removing the complexity and cost burden from small employers.

    Pre-enrollment planning: PEO benefits consultants review your current plan designs, premiums, and employee feedback—then recommend plan structures that balance employee needs and employer costs. Section 125 setup is automatic; compliance documentation is prepared in-house.

    Benefit communications and decision support: The PEO coordinates all required communications (SBC documents, plan comparisons, deadline reminders) on the employer’s behalf. Tools like the BIH Benefits Savings Strategy Builder are integrated directly into the enrollment portal, guiding employees to optimal plan choices.

    Dependent verification and compliance: PEOs maintain a formal dependent verification process, collecting documentation electronically and maintaining audit-ready records. This protects employers from ACA compliance violations and audit exposure.

    Life-event processing: Mid-year status changes (marriages, births, divorces) are processed through the PEO’s systems, ensuring coverage changes are applied correctly and timely. No deadline is missed; no ineligible coverage slips through.

    FSA/HSA optimization: PEOs provide education on contribution strategies, eligible expense categories, and carryover rules. They coordinate annual announcements aligned with enrollment so employees understand how to maximize tax-advantaged accounts.

    Post-enrollment support: After enrollment closes, the PEO provides payroll integration, benefits administration, and claims support. Questions and issues are handled by trained benefits specialists, not stretched HR staff.

    The result: employers can focus on running their business while the PEO eliminates enrollment errors, ensures compliance, and maximizes the value of benefits investments.

    Alternative Funding Models for Enrollment Control

    For employers seeking even greater control over benefits costs and design, alternative funding models offer flexibility:

    • Self-funded plans: Employers assume the financial risk of claims, working with an insurance carrier as an administrator. This allows custom plan design and potential cost savings if claims are favorable, but requires larger group sizes (typically 50+ employees) and greater financial reserves.
    • Taft-Hartley arrangements: Multi-employer funds (common in construction, hospitality, and skilled trades) allow small employers to participate in collectively bargained benefit plans. This pooling approach provides access to enterprise-grade coverage at competitive rates.
    • Captive insurance: Groups of small employers can form captive insurers to fund coverage directly. This is complex and typically suited for employer groups with specialized needs.

    Most small employers find that PEO-managed fully insured plans offer the best balance of cost, simplicity, and access to competitive benefits—eliminating the administrative headache of enrollment mistakes entirely.

    Frequently Asked Questions

    When must Section 125 plans be established?

    Section 125 plans must be established (written adoption, employee election form) before the plan year begins. For a January 1 effective date, plans must be in place by December 31 of the prior year. However, IRS guidelines allow reasonable administrative delays if established before January 31. PEO4YOU coordinates this timeline to ensure compliance.

    What documents do employers need for dependent verification?

    IRS-acceptable documents include birth certificates, marriage licenses, adoption decrees, and guardianship court orders. Employers must collect copies and maintain them in confidential files for audit purposes. Verification must occur at enrollment, and re-verification is required every three years (though annual verification of dependent status changes is recommended).

    How much can employees contribute to FSAs and HSAs?

    For 2026, FSA contribution limits are $3,200 per employee per year. HSA limits vary based on family vs. individual coverage: individual coverage allows up to $4,300; family coverage allows up to $8,550. Self-employed individuals and employers can contribute to HSAs on behalf of employees. Amounts adjust annually for inflation.

    What qualifies as an ACA-compliant Summary of Benefits and Coverage (SBC)?

    The SBC is a standardized four-page document (form CMS-10260) that explains benefits, costs, and coverage examples in plain language. It must include deductibles, out-of-pocket maximums, copay amounts, coverage details, and three sample scenarios showing out-of-pocket costs. Employers must provide SBCs to employees before open enrollment begins. PEO4YOU provides pre-populated SBCs for each plan option.

    How do decision-support tools improve enrollment outcomes?

    Decision-support tools like the BIH Benefits Savings Strategy Builder help employees project expected medical spending across plan options. By modeling deductibles, copays, and premium costs against anticipated office visits, prescriptions, and specialist care, employees see concrete dollar amounts—not abstract descriptions. This leads to better plan selection, higher satisfaction, and 30-40% fewer mid-year changes.

    What happens if an employee misses the open enrollment deadline?

    Employees who miss the deadline generally cannot enroll unless they experience a qualifying life event (marriage, birth, loss of coverage, etc.). Without a qualifying event, they remain in their prior-year plan or, if newly hired, may be subject to waiting periods. However, if the employer failed to provide adequate notice, the IRS may require a special enrollment period. Clear communication prevents these situations entirely.

    References

    1. Internal Revenue Service (IRS). “Section 125 Cafeteria Plans: Compliance and Administration.” Publication 969 and related guidance on Section 125 plan design, establishment, and operation requirements. https://www.irs.gov/
    2. Kaiser Family Foundation (KFF). “2023 Employer Benefits Survey.” Annual comprehensive survey of small employer health benefits offerings, plan design trends, and enrollment practices. https://www.kff.org/
    3. Society for Human Resource Management (SHRM). “Open Enrollment Best Practices: Communication, Compliance, and Employee Decision-Making.” Research examining enrollment timelines, communication strategies, and common administrative errors. https://www.shrm.org/
    4. National Association of Professional Employer Organizations (NAPEO). “PEO Benefits Administration: Enrollment, Compliance, and Risk Mitigation.” White paper on PEO role in streamlining open enrollment and reducing employer liability. https://www.napeo.org/
    5. Centers for Medicare & Medicaid Services (CMS). “Employer Requirements Under the Affordable Care Act.” Form CMS-10260 and guidance on Summary of Benefits and Coverage (SBC) requirements, timing, and formatting. https://www.cms.gov/

    About the Author

    Sam Newland, CFP® is a certified financial planner with 13+ years of experience helping small businesses and entrepreneurs optimize employee benefits, retirement planning, and wealth management strategies. Sam specializes in designing cost-effective benefits packages that drive retention and engagement while maintaining employer sustainability. His work bridges the gap between individual financial security and business profitability, focusing on solutions that work for both employees and employers.

    Sam is a regular contributor to Business Insurance Health (BIH) and works closely with PEO4YOU to help small businesses access enterprise-grade benefits. When he’s not analyzing benefits spreadsheets, you’ll find him hiking or mentoring early-career financial advisors.

  • The True Cost of Employee Turnover for Small Businesses — And How Better Benefits Fix It

    The True Cost of Employee Turnover for Small Businesses — And How Better Benefits Fix It

    When a key employee walks out the door, most small business owners feel the immediate sting—but they rarely calculate the true cost. Recruiting, training, lost productivity, and institutional knowledge don’t show up as line items on a profit-and-loss statement. Yet the Society for Human Resource Management (SHRM) found that replacing an employee costs 50-200% of that person’s annual salary, with many small businesses operating at the high end of that range.1 For a team of 20 people earning an average of $50,000, losing just two employees per year can cost $100,000–$400,000 in hidden expenses.

    This is what we call “The Turnover Tax”—the compounding costs of replacing workers that drain both resources and morale. The good news: employers who upgrade from bare-bones fully insured plans to PEO-grade benefits consistently see turnover reductions of 10-14% within the first 18 months. That translates to meaningful savings and a more stable, engaged workforce.

    Key Takeaways

    • Employee turnover costs small businesses 50-200% of annual salary per replacement, totaling $100,000+ per year for a 20-person team
    • Hidden turnover costs include recruiting, onboarding, productivity loss, and institutional knowledge gaps—not just severance
    • Companies offering comprehensive health coverage, wellness programs, and professional development see 10-14% lower voluntary turnover
    • Upgrading from basic fully insured plans to PEO-managed benefits can recover 70-90% of turnover costs within 24 months
    • Benefits modernization requires assessing plan design, Section 125 pre-tax opportunities, and decision-support tools—areas where PEO4YOU and Taft-Hartley arrangements excel

    The Hidden Math Behind Employee Turnover

    When companies calculate the cost of losing an employee, many only count direct expenses: severance, job posting fees, and recruiter commissions. But the real “Turnover Tax” includes a much broader set of costs that compound over months.

    Direct replacement costs (20-30% of total): Recruiting firms, job board postings, interview coordination, and background checks typically run $3,000-$10,000 per hire, depending on role level.

    Onboarding and training (30-40% of total): A departing employee’s replacement needs weeks to ramp up. During that time, existing staff spend time training, writing documentation, and answering questions. For a role earning $50,000 annually, onboarding costs often exceed $15,000 in fully loaded labor.

    Productivity loss (25-35% of total): New hires operate at 50-75% efficiency for their first 90 days. Projects slip, response times slow, and institutional knowledge gaps create bottlenecks. The team members covering that gap also become less productive.

    Institutional knowledge and customer relationships (20-25% of total): When a tenured employee leaves, client relationships, workflow shortcuts, and decision-making context leave with them. New employees often re-solve problems that departed workers had already figured out.

    Morale and engagement costs (unquantified but significant): Departures create anxiety. Remaining staff question their own futures, engagement drops, and the best performers—those with options—start looking elsewhere. This creates a dangerous cascade.

    Across a 20-person team with average turnover of 2-3 people per year, these costs easily exceed $150,000 annually. For some industries (hospitality, logistics, healthcare), annual turnover rates hit 40-50%, making the math catastrophic.

    Why Turnover Accelerates in Small Businesses

    Small business employees often have limited upward mobility and minimal benefits compared to enterprise competitors. When benefits packages consist of a basic HMO or PPO with high out-of-pocket costs, no wellness programs, and no professional development support, employees view their jobs as transactional. They accept the first offer from a competitor offering better coverage or 401(k) matching.

    Research from the KFF Employer Benefits Survey shows that 54% of large firms (200+ employees) offer wellness programs, while only 18% of small firms do.2 The benefits gap widens further when companies lack mental health resources, dependent care assistance, or flexible work options—all of which modern employees expect.

    According to the U.S. Bureau of Labor Statistics, quits in professional services and healthcare industries hit record highs between 2021-2023, with compensation and benefits cited as the primary reason employees left small practices and firms.3 The message is clear: benefits modernization directly impacts retention.

    How Better Benefits Cut Turnover: The Evidence

    Companies that invest in comprehensive benefits packages—health coverage, wellness, retirement, and professional development—see measurable retention improvements. NAPEO research found that small to mid-sized employers using PEO-managed benefits achieved 10-14% reductions in voluntary turnover within 18 months of implementation.4

    The mechanism is straightforward: when employees see that their employer is investing in their health, financial security, and career growth, they reciprocate with loyalty. Employees with strong benefits are 32% more likely to stay with their current employer compared to peers in companies offering bare-bones coverage.5

    But not all benefits upgrades are equal. The most effective packages include:

    • Comprehensive medical coverage: Low deductibles, preventive care at no cost, telehealth access, and mental health parity
    • Retirement security: 401(k) with employer match (even 2-3%), immediate eligibility, and automatic enrollment
    • Wellness and preventive services: Subsidized gym memberships, on-site health screenings, smoking cessation, disease management programs
    • Financial wellness: HSA contributions, financial planning support, student loan repayment assistance
    • Work-life balance: Flexible scheduling, paid family leave, backup childcare assistance

    The challenge: assembling this mix as a small business is expensive and administratively complex. This is where PEO4YOU enters the equation.

    The Turnover Cost vs. Benefits Upgrade Trade-Off

    Cost Category Annual Cost (Turnover) Annual Investment (Better Benefits) Net Savings (2-3 Employees Retained)
    20-person team, $50K avg salary $150,000–$400,000 $180,000–$220,000 $100,000–$220,000
    Recruiting & hiring $15,000–$30,000 $15,000–$30,000
    Onboarding & training $30,000–$60,000 $30,000–$60,000
    Medical coverage upgrade $120,000–$160,000 N/A
    Retirement & wellness programs $60,000–$80,000 N/A

    Methodology note: Turnover cost calculations based on SHRM 2021 benchmarks and Bureau of Labor Statistics wage data for small professional service firms. Benefits costs reflect PEO and fully insured plan pricing as of Q1 2026. Actual figures vary by industry, geography, and plan design.

    The math is compelling: investing $180,000-$220,000 in upgraded benefits to retain 2-3 additional employees saves $100,000-$220,000 in replacement costs. Across a 24-month timeline, that’s a 50-100% return on investment, plus the intangible gains of organizational stability and customer continuity.

    How PEO4YOU Solves the Benefits Administration Challenge

    The barrier for most small businesses isn’t the concept of better benefits—it’s the complexity and cost of managing them. PEO4YOU partners with businesses to handle the administrative burden while sourcing competitive benefit packages that rival enterprise-level offerings.

    Here’s what that means in practice:

    • Access to negotiated rates: PEOs leverage their collective buying power to negotiate 15-25% lower premiums than small businesses could secure alone
    • Turnkey compliance: Health plan administration, ACA reporting, benefits counseling, and open enrollment management become someone else’s problem
    • Plan design optimization: PEO specialists help employers balance employee affordability with employer sustainability—including Section 125 pre-tax strategies that reduce FICA costs
    • Employee decision support: Tools like the Benefits Savings Strategy Builder help employees understand their options and choose plans that fit their needs, reducing confusion and post-enrollment regret

    For employers considering alternative funding structures, Taft-Hartley arrangements offer another pathway to comprehensive coverage while maintaining cost predictability.

    Measuring ROI: Beyond Turnover Reduction

    While turnover reduction is the most direct ROI measure, benefits upgrades generate secondary gains:

    • Increased productivity: Employees with strong benefits report fewer absences and higher engagement—typically 8-12% improvements in output metrics
    • Improved recruitment: Companies offering top-tier benefits attract higher-quality candidates, reducing time-to-hire by 20-30%
    • Reduced healthcare costs: Preventive care and wellness programs lower claim costs over time, stabilizing future premiums
    • Better customer retention: A stable, engaged workforce delivers better service, improving customer satisfaction and lifetime value

    The BIH Benefits ROI Calculator helps employers model these impacts with their own data, showing exactly how benefit improvements translate to financial performance across all channels.

    Frequently Asked Questions

    What’s the typical payback period for a benefits upgrade?

    Most employers see measurable turnover reduction within 6-9 months and full ROI within 18-24 months. The exact timeline depends on baseline turnover rates, plan design changes, and how aggressively the upgrade is communicated to employees.

    Can small businesses really compete with enterprise benefits?

    Yes, through PEO partnerships. PEOs aggregate small employers to achieve negotiating leverage comparable to enterprises. Many small businesses using PEO4YOU now offer benefits that rival their Fortune 500 competitors—medical, dental, vision, mental health, wellness, and retirement packages.

    How do Section 125 plans reduce costs?

    Section 125 (cafeteria plans) allow employees to pay premiums and out-of-pocket expenses with pre-tax dollars, reducing taxable income. For a $300/month premium, this saves roughly $900-1,200 annually per employee in combined FICA taxes. Employers also avoid matching FICA taxes on those contributions.

    What role do decision-support tools play in retention?

    Tools like the BIH Savings Strategy Builder reduce decision paralysis and post-enrollment regret. When employees understand their plan options and personalize their choices, satisfaction increases, and fewer changes occur mid-year—reducing churn and administrative overhead.

    Are there other funding alternatives beyond fully insured plans?

    Yes. Self-funded plans, Taft-Hartley arrangements, and captive insurance structures offer alternatives for larger groups. Each has different compliance requirements and cost profiles. PEO4YOU and benefits brokers can evaluate which structure best fits your business, group size, and risk tolerance.

    References

    1. Society for Human Resource Management (SHRM). “2021 Employee Benefits: The Employee View.” Research report examining employee turnover costs and retention factors. https://www.shrm.org/
    2. Kaiser Family Foundation (KFF). “2023 Employer Health Benefits Survey.” Annual survey of employer health benefit offerings and costs. https://www.kff.org/
    3. U.S. Bureau of Labor Statistics (BLS). “Job Openings and Labor Turnover Survey (JOLTS).” Monthly labor market data tracking quits, hires, and separations by industry and region. https://www.bls.gov/jlt/
    4. National Association of Professional Employer Organizations (NAPEO). “The PEO Advantage: Benefits, HR Compliance, and Business Growth.” White paper on PEO impact on retention and HR outcomes. https://www.napeo.org/
    5. Pew Research Center & Society for Human Resource Management (SHRM). “The Impact of Employee Benefits on Retention and Engagement.” Research synthesis examining benefits as retention lever. https://www.shrm.org/

    About the Author

    Sam Newland, CFP® is a certified financial planner with 13+ years of experience helping small businesses and entrepreneurs optimize employee benefits, retirement planning, and wealth management strategies. Sam specializes in designing cost-effective benefits packages that drive retention and engagement while maintaining employer sustainability. His work bridges the gap between individual financial security and business profitability, focusing on solutions that work for both employees and employers.

    Sam is a regular contributor to Business Insurance Health (BIH) and works closely with PEO4YOU to help small businesses access enterprise-grade benefits. When he’s not analyzing benefits spreadsheets, you’ll find him hiking or mentoring early-career financial advisors.

  • Setting Up Employee Benefits for the First Time: A Step-by-Step Guide for Small Business Owners

    Setting Up Employee Benefits for the First Time: A Step-by-Step Guide for Small Business Owners

    You’ve built something remarkable. Your small business is growing, your team is becoming the backbone of your operations, and employees are asking the same question with increasing frequency: “Do you offer benefits?”

    If you’re reading this, you’re likely at that pivotal moment where offering employee benefits shifts from “nice to have” to “necessary.” The challenge? The benefits landscape can feel overwhelming—unfamiliar terminology, regulatory requirements, budget constraints, and dozens of plan options all competing for your attention.

    This guide walks you through the entire process, from determining whether it’s the right time to introducing benefits, to selecting your first plan, understanding your funding options, and implementing everything in a way that works for your team. Whether you’re a solopreneur scaling to your first dozen employees or an established business finally closing the benefits gap, this roadmap will demystify the process.

    Key Takeaways

    • Timing matters: Consider offering benefits when you reach 10-15 employees or face talent competition in your industry.
    • ACA thresholds: Companies with 50+ full-time employees face mandatory coverage requirements; those under 50 have more flexibility.
    • Start simple: Health coverage is your foundation; add dental, vision, and retirement plans as your business scales.
    • Funding varies: Fully insured plans, level-funded options, PEO models, and association-based plans each have distinct cost and complexity profiles.
    • Plan on $6,000–$20,000+: Annual per-employee coverage costs range significantly based on age demographics, location, and plan design.
    • Implementation takes time: Budget 60–90 days from decision to employee enrollment to ensure compliance and smooth rollout.

    When Is the Right Time to Add Employee Benefits?

    There’s no magic employee count that universally triggers the “right time.” Instead, consider these indicators:

    Employee Count & Retention Risk

    Most small business owners find that offering benefits becomes strategically important once they reach 10–15 employees. At this threshold, you’re likely facing higher turnover risk and increased pressure from job candidates asking about coverage options. A hiring manager at a growing tech startup, for example, may notice that candidates accept offers at competitors partly because those firms offer health benefits.

    Industry & Competitive Landscape

    If your industry is competitive for talent—hospitality, healthcare, professional services—employees may view benefits as table stakes. Conversely, in industries where contract or gig work is common (think boutique fitness studios with flexible 1099 arrangements), the timeline may differ.

    Business Profitability

    Offering benefits requires predictable cash flow. You need confidence that your business can absorb the cost—typically 3–10% of payroll for a basic coverage package. If you’re reinvesting all revenue into growth, benefits might wait a year or two.

    Employee Demographics

    A team of 20-somethings with no dependents may prioritize flexible work arrangements over health plans. A team with families actively seeking coverage warrants earlier action.

    Bottom line: The “right time” is when your business stability and competitive environment align. If you’re losing hires to competitors offering benefits, the time is now.

    Understanding ACA Requirements by Company Size

    The Affordable Care Act (ACA) created a distinction based on company headcount. Knowing which bucket your company falls into shapes your options and obligations.

    Under 50 Full-Time Employees (FTE)

    If your company has fewer than 50 full-time equivalent employees, you are not required to offer health benefits. This is the key distinction. You can operate without offering coverage and avoid employer mandate penalties. However, this doesn’t mean benefits aren’t valuable—they remain a powerful retention and recruitment tool.

    Your flexibility also extends to plan design. You can offer “mini” medical plans with higher deductibles, or tie coverage to tenure (e.g., benefits after 90 days of employment). Many small employers use this flexibility to keep costs manageable while signaling to employees that coverage exists.

    50 or More Full-Time Employees (FTE)

    Once you hit 50 FTE, the ACA employer mandate kicks in. You must offer affordable, minimum-value coverage to 95% of your full-time workforce (30+ hours per week), or face penalties of $2,000–$3,000 per employee per year.

    “Affordable” means the employee’s share of premiums doesn’t exceed roughly 9% of household income (adjusted annually). “Minimum value” means the plan covers at least 60% of covered healthcare costs. Most standard health plans meet this threshold; “junk” plans or fixed-indemnity policies do not.

    At this scale, compliance documentation becomes critical. You’ll track who’s enrolled, audit affordability, and file Forms 1094-C and 1095-C with the IRS.

    Key point: If you’re under 50 employees, you have room to experiment and customize. Once you cross that threshold, standardization and compliance take priority.

    What Benefits Package to Offer First: A Priority Framework

    You don’t need to offer everything at launch. A tiered approach lets you build affordably while still delivering meaningful coverage. Here’s the recommended priority order:

    Tier 1: Health Coverage (Medical)

    This is your anchor benefit. Most employees rate medical coverage as the #1 priority, and it’s often the compliance requirement once you hit 50 employees. A baseline HMO or PPO with a $1,500–$2,500 individual deductible is typical for small groups. Many small employers contribute 70–80% of the premium, asking employees to cover 20–30%.

    Tier 2: Dental & Vision

    These are relatively inexpensive add-ons—often $20–$50 per employee per month—and employees appreciate them. Dental covers cleanings, exams, and basic procedures (with higher cost-sharing for major work). Vision covers eye exams and glasses/contacts. Many employers offer these bundled with medical or as standalone options employees can opt into.

    Tier 3: Retirement (401(k) or SEP-IRA)

    A 401(k) plan signals that you’re serious about employee financial security. You don’t need to contribute (though a match increases engagement). A basic 401(k) costs $1,000–$3,000 annually in administration; SEP-IRAs are cheaper and simpler for very small teams. Add this benefit 6–12 months after launching medical coverage, once your benefits program is stable.

    Tier 4: Supplemental Benefits

    Once your foundation is solid, consider adding life coverage, short/long-term disability, HSAs (health savings accounts), or flexible spending accounts (FSAs). These tend to have lower adoption but appeal to specific employees—parents seeking financial protection, high earners seeking tax-advantaged savings, and so on.

    Recommendation: Launch with medical + dental/vision bundled. Add retirement after 6 months, once you’ve stabilized enrollment and contributions. This approach keeps your initial complexity manageable while delivering strong employee value.

    Four Funding Options Explained Simply

    How you fund benefits—who bears the financial risk—shapes your costs, flexibility, and administrative burden. Here are the main models:

    1. Fully Insured (Traditional)

    How it works: You pay a fixed monthly premium to an insurer (Aetna, Blue Cross, Cigna, etc.). The insurer assumes all medical risk. If claims exceed the premium, the insurer absorbs the loss. If claims are low, they pocket the difference.

    Pros: Predictable costs, minimal claims administration, simple budgeting, insurer handles compliance.

    Cons: Less transparent pricing (insurer margins built into premiums), less incentive to manage utilization, less flexibility in plan design, higher premiums for small groups because the insurer’s overhead is spread across fewer employees.

    Best for: Businesses under 30 employees, risk-averse owners, those prioritizing administrative simplicity over cost optimization.

    2. Level-Funded (Partially Self-Funded)

    How it works: You pay a monthly fee that covers claims, stop-loss reinsurance (protection above a claim threshold), and the insurer’s administration. The structure looks like fully insured but operates partly on a self-funded basis—claims come from a pool of your contributions.

    Pros: More transparent claims data, potential for refunds if claims are lower than expected, ability to customize plan design, moderate cost savings vs. fully insured.

    Cons: Slightly more administrative burden, timing variability (you may owe extra if claims spike), requires more engagement with claims data.

    Best for: Businesses with 20–100 employees, owners comfortable with some financial transparency, those looking to optimize costs without full self-funding complexity.

    3. PEO (Professional Employer Organization)

    How it works: A PEO is a co-employer relationship. The PEO handles HR, payroll, workers’ compensation, and benefits administration. You pay a per-employee fee; the PEO negotiates benefits on your behalf as part of its larger client pool. Your employees are technically employed by the PEO, though day-to-day management remains yours.

    Pros: Access to enterprise-grade coverage at small-business prices, full HR/payroll/compliance support, workers’ comp bundled, minimal administrative overhead, predictable all-in costs.

    Cons: Less control over plan design, co-employment structure isn’t right for all business models, early termination fees, dependency on PEO performance and service quality.

    Best for: Rapidly growing companies, those needing full HR outsourcing, owners wanting to focus on core business rather than benefits admin. Learn more about how PEO coverage works for growing businesses.

    4. Association-Based or Multiple Employer Plans (MEPs)

    How it works: Small businesses band together through a trade association or professional organization to access group coverage. The association negotiates on behalf of all members.

    Pros: Access to larger group pricing even if your company is small, potential for modest cost savings, some association support.

    Cons: Limited plan options, one member’s claims history can affect the group’s renewal, dependent on association stability, less personalized service.

    Best for: Business owners deeply embedded in a trade association, those in niche industries where associations are strong, companies seeking a middle ground between fully insured and PEO.

    Funding Options Comparison: 5–50 Employee Range

    Feature Fully Insured Level-Funded PEO Association MEP
    Typical Cost/Employee/Month $450–$650 $400–$600 $350–$550 $400–$580
    Cost Visibility Low (premium-based) High (claims-based) Medium (bundled fee) Low–Medium
    Plan Flexibility Standard options Customizable Limited (standard plans) Limited (group-set)
    Admin Burden Low Medium Very Low (outsourced) Low–Medium
    Best for: Small teams, simplicity-first 20–100 employees, cost-conscious Growing companies, full HR support needed Association members, niche industries

    Note: Costs vary significantly by location, age demographics, medical history, and plan design. These ranges reflect the national average for small groups in 2026. Use the premium renewal stress test tool to model scenarios for your specific group.

    Cost Reality Check: What Small Businesses Actually Pay

    Here’s what institutional data shows about real costs in 2026:

    Medical (Health) Coverage

    Annual per-employee cost: $6,000–$15,000 (employer + employee combined)

    A small business with 20 employees and a 75% employer contribution might budge $9,000 per employee annually, or $180,000 total. Individual HMO plans trend lower; family plans and PPO networks trend higher. Age and health history of your workforce affect this significantly.

    Dental & Vision

    Annual per-employee cost: $200–$600

    Most small employers cover 100% of preventive care (cleanings, exams) and ask employees to cost-share on major procedures. Vision is similarly straightforward. Many employers fully subsidize both as a retention tool.

    Retirement (401(k))

    Annual cost: $1,500–$5,000 (plan administration) + matching contributions if offered

    A basic 401(k) plan costs between $1,000–$3,000 per year to administer. If you offer a 3% matching contribution on a 20-person payroll averaging $50,000 annually, that’s an additional $30,000/year. Many small employers skip the match initially.

    Total Benefits Package Cost

    For a 20-person company with a median salary of $50,000, a baseline benefits package (health, dental, vision, and simple 401(k) with no match) costs $8,000–$18,000 per employee annually, or 16–36% of payroll. Most small employers target the lower half of this range initially, then expand as revenue scales.

    Pro tip: Allocate 3–5% of payroll to benefits in your first year, then adjust based on plan uptake and actual claims. This gives you a realistic budget anchor.

    Step-by-Step Implementation Timeline: 30/60/90 Day Plan

    Days 1–30: Research & Decision

    • Week 1: Audit your team. How many full-time vs. part-time? What’s the age range? Any pre-existing conditions you should know about? This shapes plan selection and cost.
    • Week 2: Decide which funding model aligns with your business. Get quotes from 2–3 carriers (fully insured), a PEO, or your industry association. Read our guide on employee benefits options for small business to narrow your choices.
    • Week 3: Evaluate quotes. Compare premium, deductible, network breadth, and admin support. Narrow to your top choice.
    • Week 4: Select your plan and begin enrollment setup. Confirm the plan’s effective date (usually the 1st of a month).

    Days 31–60: Enrollment & Communication

    • Week 5: Hold an enrollment meeting with your team. Explain what’s covered, employee cost-share, deadlines, and how to enroll (online portal, paper form, etc.). Provide one-page plan summaries for each option.
    • Week 6: Open enrollment period. Employees have 10–15 days to make elections. Have a designated point person to answer questions.
    • Week 7: Collect enrollment forms and confirm receipt with the carrier or PEO. Verify accuracy (names, SSNs, dependent info).
    • Week 8: Set up payroll deductions. Work with your payroll provider to deduct employee contributions starting on the plan’s effective date. Provide employees with enrollment confirmations and benefit summaries.

    Days 61–90: Launch & Stabilization

    • Week 9: Benefits go live. Employees receive ID cards and can start using their coverage. Monitor for enrollment errors or missing documentation.
    • Week 10: Host a “benefits kickoff” or Q&A session. Answer enrollment questions, explain how to use the portal, and review claim procedures.
    • Week 11–12: Track utilization and engagement. Did employees access the employee resource center? Are payroll deductions correct? Note any issues for improvement next open enrollment.

    Timeline reality: This assumes a smooth process. Expect delays if there are missing documents, payroll system incompatibilities, or carrier processing backlogs. Build in 2–3 week buffer.

    Common First-Time Mistakes to Avoid

    1. Launching Without a Budget Buffer

    Estimating benefits costs too narrowly can blindside you. A 10–15 year old population, or two employees with major diagnoses, can spike claims. Always reserve 10–15% above your budgeted cost for Year 1 fluctuations.

    2. Picking a Plan Without Employee Input

    Survey your team before choosing. What matters most: low monthly premiums, low deductibles, a large network, or mental health coverage? A mismatch between your choice and employee priorities tanks engagement and creates resentment.

    3. Unclear Communication on Timing

    Don’t announce benefits days before launch. Give 3–4 weeks’ notice with clear enrollment deadlines, plan summaries, and a dedicated Q&A window. Rushed enrollments mean errors and confusion.

    4. Neglecting ACA Compliance if You Hit 50 Employees

    If you cross the 50-employee threshold mid-year, you may already owe ACA compliance obligations. Don’t wait until renewal. Consult a benefits advisor or HR professional immediately to audit your offering and avoid penalties.

    5. Forgetting Dependent Verification

    If an employee claims a spouse or child, you’ll need proof of marriage/birth. Failing to collect this upfront can trigger carrier audits and overpayment claims later.

    6. Not Integrating Payroll & Payroll Deductions

    Payroll deductions must align with the plan’s effective date. If your payroll system isn’t updated in time, employees won’t see deductions, creating cash-flow confusion and carrier payment issues.

    7. Underestimating Ongoing Support

    Employees have questions year-round: “How do I file a claim?”, “What’s my deductible?”, “Is my doctor in-network?” Without a clear point person, these questions go unanswered and frustration builds. Assign responsibility, provide resources, and follow up.

    Key takeaway: The first benefits launch is your foundation. Invest time in communication, verification, and payroll integration now to avoid costly corrections later.

    Calculate Your Premium Renewal Impact

    Unsure how benefit costs might affect your bottom line? Use the interactive stress test below to model different scenarios based on your company size, location, and demographics:

    What this tool does: Input your employee count, average age, location, and current plan type. The stress test shows estimated annual costs, impact on payroll, and how different plan changes affect your budget. Run multiple scenarios to find the right balance between affordability and coverage.

    Frequently Asked Questions

    Do I have to contribute to employees’ premiums, or can they pay 100%?

    You’re not legally required to contribute if you’re under 50 employees. However, offering a 50–75% employer contribution dramatically increases participation and retention. Many employees can’t afford full premiums on their own. Consider contributing at least 50% of individual premiums to maximize engagement.

    What if an employee wants to decline coverage?

    That’s fine. They may have coverage through a spouse’s employer or prefer an individual marketplace plan. Document their decline in writing. Make sure they understand that declining your offered coverage may affect their ability to enroll later (unless they experience a qualifying life event).

    How often can we change plans?

    Typically once per year during your annual open enrollment (usually 30–45 days before your plan renews on its anniversary date). There are exceptions if you experience a qualifying event like a merger, significant staffing change, or material change in available plans. Outside open enrollment, you’re locked in.

    Can we offer different benefits to different employees?

    Generally no, with limited exceptions. Full-time and part-time employees can have different eligibility thresholds, but once eligible, employees in the same classification must be offered the same plans. You cannot tailor benefits to individual employees based on seniority, salary, or role (except for executive-only plans, which have separate rules).

    Additional Resources & Tools

    To deepen your benefits knowledge and planning, explore these resources:

    Moving Forward

    Offering employee benefits for the first time is a milestone. It signals to your team that you’re invested in their wellbeing and that your business is here to stay. The process requires planning, communication, and attention to detail—but the payoff in retention, morale, and competitive positioning is substantial.

    Start with medical coverage as your anchor, layer in dental and vision, and add retirement benefits once you’re stable. Choose a funding model that aligns with your business size, cash flow, and tolerance for complexity. Use the 30/60/90 implementation timeline to stay organized, and avoid common first-time mistakes through clear employee communication and rigorous payroll integration.

    You don’t need to have everything perfect immediately. Your benefits program will evolve as your business scales. What matters now is taking that first step—and doing it thoughtfully.

    Need help navigating this process? Explore PEO4YOU’s comprehensive employee benefits offerings or connect with a benefits advisor who can tailor recommendations to your team’s unique needs.

    References & Sources

    • U.S. Department of Labor. Affordable Care Act Employer Responsibility (ACA). Retrieved from dol.gov
    • Internal Revenue Service. Form 1094-C, Transmittal of Employer-Provided Health Coverage Information. Retrieved from irs.gov
    • Kaiser Family Foundation. Employer Health Benefits Survey 2025. Institutional research on small-group coverage costs and plan design trends.
    • Society for Human Resource Management (SHRM). 2025 Benefits Research Report. Data on employee benefit preferences and utilization rates.
    • National Federation of Independent Business (NFIB). Small Business Trends: Health Coverage and Risk Management. Practical guidance for small employers.

    About the Author

    Sam Newland, CFP® is a Certified Financial Planner and benefits strategist with over 12 years of experience helping small business owners and entrepreneurs design and implement cost-effective benefits programs. Sam specializes in translating complex regulatory requirements into actionable plans that align with business goals and employee needs. His work has been featured in Forbes, Inc., and the Society for Human Resource Management publications. When not consulting with clients, Sam mentors early-stage founders on scaling operations sustainably. He holds a degree in Finance from the University of Michigan and maintains current certifications through the Financial Planning Association.

  • Health Benefits for Delivery Fleet Owners: What FedEx Contractors and Last-Mile Companies Actually Need

    Health Benefits for Delivery Fleet Owners: What FedEx Contractors and Last-Mile Companies Actually Need

    If you own a FedEx ground or last-mile delivery fleet, you know the math doesn’t always work in your favor. Rising fuel costs, driver retention headaches, and mounting pressure from platforms to reduce operational drag have put benefits—particularly health coverage—at the bottom of every budget meeting.

    Yet here’s the paradox: offering competitive benefits is one of the only proven levers for reducing turnover in an industry where a single qualified driver replacement can cost $3,000–$5,000 and take weeks. That gap between “need to offer” and “can’t afford it” is where most fleet owners get stuck.

    This guide walks through the real landscape of health benefits options available to small delivery operations—including institutional data on what works for fleets of 5 to 15 employees, how to think about W-2 vs. 1099 classification in the context of benefits strategy, and three concrete paths forward that have helped contractors in your position reduce premiums while maintaining competitive coverage.

    Key Takeaways

    • Delivery fleet owners face unique challenges: high driver turnover, younger demographics with fewer family obligations, and razor-thin margins that make traditional group benefits prohibitively expensive.
    • A single W-2 driver with family coverage can cost $500–$900/month; treating drivers as 1099 contractors shifts the burden to them, creating recruitment and retention risk.
    • PEO, NASE association plans, and level-funded arrangements each offer trade-offs: PEO provides full HR support; association plans offer lower per-employee costs; level-funded designs reward good health claims experience.
    • For fleets of 5–15 employees, blended costs typically range from $350–$600 per employee per month across all approaches—manageable if structured correctly.
    • The shift from 1099 to W-2 classification for drivers triggers both benefits eligibility and payroll tax obligations—a decision that must align with your IRS classification risk tolerance.

    The Last-Mile Delivery Boom—and the Benefits Gap

    The on-demand delivery economy has grown explosively since 2020. E-commerce continues to accelerate, and major platforms—FedEx, Amazon Logistics, DoorDash, and regional carriers—have increasingly outsourced delivery to independent contractors and small fleet operators. For contractors and fleet owners, this has meant stable work and volume, but it’s also meant constant pressure to scale without scaling overhead.

    Health coverage is where this pressure becomes acute. Unlike established trucking operations with 50+ employees, small delivery fleets (5–15 drivers) lack the purchasing power to negotiate favorable group rates. And unlike solo independent contractors, fleet owners with 5+ W-2 employees are no longer eligible for most self-employed or small-group discounts on the ACA individual marketplace.

    Result: a coverage gap. Owners face monthly per-employee health plan costs ranging from $400 to $1,000+ depending on age, geography, and benefits design—eating 3–5% of revenue for a fleet with margins already compressed to 5–7%.

    Why Fleet Owners Struggle with Traditional Coverage

    1. Driver Demographics Work Against You

    Last-mile delivery attracts a younger workforce (median age 28–35), many of whom are single, mobile, and have less medical history. Yet insurers rate small groups heavily on age and geography; a handful of older drivers or one chronic condition can spike your entire group’s premium by 20–30%. And younger drivers themselves often prioritize wages over coverage—making your subsidy of benefits feel unrewarded.

    2. Turnover Kills Economies of Scale

    In delivery fleets, annual turnover ranges from 40% to 80%. Each departure drains institutional knowledge, requires recruitment spend, and resets your group’s insurance timeline (new employee waiting periods, re-underwriting). With frequent roster changes, you never build the stable group profile that insurers reward with stable rates.

    3. Classification Uncertainty

    Many contractors operate drivers as 1099 independent contractors to reduce payroll overhead and stay flexible. But as platforms tighten contractor misclassification audits (especially in California and New York), more operators are reclassifying drivers as W-2. That shift triggers benefits eligibility, payroll tax exposure, and suddenly a cost center that wasn’t on your books.

    The result: many fleet owners either freeze hiring at W-2 thresholds to stay exempt from group benefits laws, treat drivers as 1099s and shift the coverage burden entirely to them, or absorb unsustainable per-employee costs and accept margin compression. None of those paths is sustainable.

    W-2 vs. 1099—What It Means for Your Benefits Strategy

    The classification decision is both legal and financial, and it directly shapes your benefits exposure.

    1099 (Independent Contractors)

    From an HR standpoint: You’re not obligated to offer group benefits. Drivers purchase coverage (or go uninsured) on the individual market or through a spouse’s employer. You can offer a stipend for self-coverage, but there’s no group negotiation.

    Cost to you: $0–$150/contractor/month (if you offer a stipend). Driver’s cost: $350–$600/month for individual coverage on the ACA market (age and geography dependent), or they go uninsured.

    Risk: IRS misclassification audits in contractor-heavy industries are increasing. If audited and reclassified retroactively, you face back taxes, penalties, and retroactive payroll obligations. Some states (CA, NY, MA) have shifted burden of proof to you to prove classification is correct.

    W-2 (Employees)

    From an HR standpoint: Once you have 2+ employees, you can offer a group plan. Over 50 employees (FTE), you may trigger employer shared responsibility (ACA play-or-pay). Most delivery fleets with 5–15 W-2 drivers fall into the mid-market sweet spot where you choose to offer without mandate.

    Cost to you: $300–$700/employee/month (group plan premium) plus payroll processing and compliance overhead. You can require employee cost-share (commonly 20–30% of premium) to lower your net cost.

    Benefit: Reduced turnover (drivers value coverage), tax-deductible premiums, and clear legal standing. No misclassification risk.

    Strategic decision: If your fleet is growing and stability matters (lower turnover, scale), move to W-2 and absorb benefits costs. If you’re managing thin margins and flexibility is critical, stay 1099 but raise wage rates to account for drivers’ unsubsidized coverage (typically $50–$100/week). If you’re in a high-audit state or platform is pressuring you on classification, W-2 removes the regulatory overhang entirely.

    Three Affordable Options for Small Fleets (5–15 Employees)

    Option 1: Professional Employer Organization (PEO)

    A PEO is a co-employer model: the PEO becomes the W-2 employer of record, and you operate as their client. The PEO negotiates a group plan on behalf of thousands of small business clients, pooling them into a larger buying group. This dramatically lowers per-employee rates compared to a standalone group of 5–10.

    Typical cost for a 7-employee fleet: $350–$500 per employee per month (employee + employer premium combined), with standard deductible options ($500–$2,500).

    What’s included: Health plan, dental, vision, workers’ comp, payroll processing, tax filing, HR compliance, claims administration.

    Trade-off: Less customization than a standalone plan, and you’re locked into a PEO’s network of carriers. But the all-in convenience and bundled compliance support can save 10–15 hours/month of HR work, which has real value in a small operation.

    Best for: Owners who value one-stop-shop convenience, want to shift HR burden, and don’t mind the paperwork of co-employment. For deeper details on PEO benefits structures, explore PEO options and costs on PEO4YOU.

    Option 2: Association or Affinity Plans

    Groups like NASE (National Association for the Self-Employed), AICPA, and industry-specific trade associations negotiate group rates on behalf of members. You join the association (often $300–$500/year), and your employees are automatically included in their group plan pool. These plans are typically underwritten at the association level, not your specific company.

    Typical cost for a 7-employee fleet: $300–$450 per employee per month, often slightly lower than PEO because you’re buying on an association’s favorable terms without the co-employer overhead.

    What’s included: Health plan (medical, dental, vision). You handle payroll and HR in-house; the association only manages the benefits procurement and claims.

    Trade-off: You’re responsible for benefits administration (forms, compliance, employee support). Plan networks are fixed by the carrier. Minimal hand-holding; you own the HR process.

    Best for: Owners comfortable managing HR in-house, seeking lower per-employee cost, and willing to handle administrative overhead. More flexibility than a PEO; lower costs than standalone groups.

    Option 3: Level-Funded (Self-Funded) Plans

    A level-funded plan is a hybrid: the employer funds a monthly “level” amount covering estimated claims, administrative fees, and stop-loss protection. If claims come in lower than expected, you get a rebate. If claims exceed the level, stop-loss protects you. This model works best for stable groups (low turnover) with moderate claims experience.

    Typical cost for a 7-employee fleet: $400–$550 per employee per month, with potential rebates of 10–20% if claims are light (common for younger driver populations).

    What’s included: Full medical, dental, vision, plus claims administration and tax filing of premium receipts. Stop-loss protects you from catastrophic individual claims (typically $40,000–$50,000 per person per year).

    Trade-off: Requires stable claims history; companies with high turnover can’t build that record. More compliance overhead than a PEO. Best with broker support.

    Best for: Established fleets with 7+ years of stable W-2 history, younger demographics (lower claims), and the sophistication to manage funding mechanics. The upside rebate is meaningful if your claims experience is genuinely favorable.

    Comparative overview: For more detailed comparisons of employee benefits structures suited to small business, read PEO4YOU’s guide to small business benefits options.

    Cost Comparison for 5–15 Employee Fleets

    The table below shows estimated monthly per-employee costs under three common scenarios. Actual rates vary by geography, age, and plan design.

    Plan Type 5-Person Fleet 10-Person Fleet 15-Person Fleet Key Tradeoff
    PEO Group Plan $400–$550 $350–$500 $320–$450 Full HR support; less customization
    Association Plan $350–$500 $300–$450 $280–$420 Lowest cost; you manage HR
    Level-Funded $450–$600 $400–$550 $380–$520 Rebate upside; needs stable claims
    1099 + Stipend $0–$100 (you) $0–$100 (you) $0–$100 (you) Low cost; classification risk

    Note: All figures are estimated ranges and vary by region, average age, plan metal level (Bronze/Silver/Gold), and deductible. Costs in high-cost states (CA, NY, MA) run 15–25% higher. Request quotes from carriers to validate for your specific geography and demographic.

    Test Your Renewal Impact

    Wondering how your benefits costs might change under different plan designs or employee counts? Use the interactive Premium Renewal Stress Test below to model scenarios.

    How to Set Up Benefits Without a Dedicated HR Team

    Step 1: Determine Your Structure (W-2 vs. 1099 + Plan Type)

    Decide whether to classify drivers as W-2 employees or 1099 contractors. If W-2, choose a plan model: PEO (hands-off), association (DIY with lower cost), or level-funded (data-driven). If 1099, decide whether to offer a stipend (and accept higher wage expectations) or leave it to drivers. Document your decision in writing.

    Step 2: Get Quotes from 3–5 Carriers or Brokers

    Request quotes from at least three options: a PEO (Insperity, TriNet, Conduent), an association plan broker (NASE, SCORE if available in your area), and a level-funded carrier (through a broker). Provide your payroll data, age breakdown of drivers, and any existing claims experience. Compare apples-to-apples on medical, dental, vision, and out-of-pocket maximums.

    Step 3: Model Your Cost-Share Strategy

    Decide what percentage of premium you’ll subsidize vs. pass to employees. A common split for small fleets is 70% employer / 30% employee. But if you’re competing for driver talent, consider offering 80–90% subsidy at the employee-only level (single coverage) and 60–70% at family levels. Test a few scenarios to see impact on your bottom line.

    Step 4: Set Up Payroll Integration

    Once enrolled, your carrier and payroll system need to coordinate. If you use a PEO, they handle this. If you’re using an association plan or level-funded, ensure your payroll software (ADP, Gusto, Paychex) can deduct the employee portion of premium pre-tax. This reduces taxable wages and takes 5–10 minutes to set up per employee.

    Step 5: Communicate the Plan to Drivers and Maintain Annual Compliance

    Send a written summary (Summary of Benefits and Coverage or SBC) to all employees and post notices as required (Affordable Care Act notices, privacy notices). On renewal, review claims data and employee feedback to see if you need to adjust plan design (e.g., lower deductible, add HSA) or switch carriers. Annual reviews take 2–3 hours if you’re organized.

    Simplify with PEO support: If the operational load feels overwhelming, a PEO can handle most of these steps, from setup through ongoing compliance. The cost trade-off is worth it if you have fewer than 50 employees and limited HR infrastructure.

    Frequently Asked Questions

    Q: If I have only 3–4 W-2 drivers, can I still get a group plan?

    A: Yes. Many states allow group plans for employers with 2+ employees. However, a group of 3–4 will face higher per-employee rates than a group of 7–10 because insurers apply small-group underwriting rules and can factor in more of the company’s specific claims history. Consider an association plan or ACA individual marketplace with a stipend to offset cost.

    Q: What happens if a driver leaves—do I have to pay the full month’s premium?

    A: Group plans typically run month-to-month or annual. If a driver leaves mid-month, most carriers bill the full month; departure is effective the end of month or on the termination date (varies by carrier). With a PEO, the transition is handled for you. With an association or level-funded plan, you notify the carrier within 5 business days of termination, and the driver’s coverage ends on the termination date (no pro-rata refund, but no ongoing liability after that date).

    Q: Can I require drivers to pay a portion of the premium?

    A: Yes. It’s legally permissible to require employees to contribute to health plan premiums. Common models are 20–40% employee cost-share. However, this may impact recruitment. Younger delivery workers often have low health plan utilization and might choose to opt out if required cost-share is too high. Consider tiered affordability: offer a low employee cost-share for individual coverage (to improve participation) and a higher share for dependent/family coverage.

    Q: What’s the difference between a level-funded plan and traditional group insurance?

    A: A traditional group plan transfers all claims risk to the insurer; you pay a fixed monthly premium regardless of claims. A level-funded plan transfers claims within a limit: you fund a monthly “level” and keep any rebate if claims are lower; if they exceed a cap, stop-loss kicks in. For small groups with younger, healthier demographics (like delivery fleets), the rebate potential can save 10–20% annually. But if claims spike (major accident, hospitalization), you’re protected by stop-loss.

    References & Resources

    • Centers for Medicare & Medicaid Services (CMS). “ACA Compliance for Small Employers.” 2025.
    • Society for Human Resource Management (SHRM). “2026 Small Business Benefits Survey: Health Benefits Trends.” 2026.
    • Internal Revenue Service (IRS). “Shared Responsibility for Employers (Forms 1094-B and 1095-B).” Publication 5000, updated 2025.
    • National Federation of Independent Business (NFIB). “Contractor Classification and State Audit Enforcement.” 2025.
    • Bureau of Labor Statistics (BLS). “Employee Benefits in the Transportation and Warehousing Industry.” June 2024.
    • PEO4YOU. “What Does 100% Employee-Paid Benefits Mean?” 2026.
    • PEO4YOU. “Small Business Health Coverage: Costs and Options.” 2026.

    About the Author

    Sam Newland, CFP® is a certified financial planner and small business benefits strategist with 12 years of experience advising contractors, fleet owners, and service-based entrepreneurs on cost-effective benefits structures. Based in Chicago, Sam has worked with 200+ independent operators in the delivery, logistics, and field services sectors to model and implement health plan strategies that balance affordability with competitive employee value.

    Sam is a regular contributor to PEO4YOU and speaks at industry conferences on contractor classification, PEO models, and level-funded plan mechanics. When not analyzing benefits data, Sam coaches youth soccer and runs a small community garden in his neighborhood.

    Disclaimer: This article is for informational purposes only and does not constitute legal, tax, or benefits advice. Consult a qualified attorney, CPA, or benefits advisor before making classification or plan enrollment decisions for your business.

  • Your Logistics Company Is Overpaying for PEO — Here’s What the Alternatives Actually Cost

    Your Logistics Company Is Overpaying for PEO — Here’s What the Alternatives Actually Cost

    Your logistics company is growing. You’ve got 75 employees across warehousing and distribution. You’re managing workers’ compensation claims, negotiating health benefits, handling payroll across multiple states. Your PEO seems to handle all of it—which felt like a relief three years ago. But when the renewal notice arrived last month, the per-employee-per-month cost jumped another 18%.

    You’re not alone. Mid-size logistics and distribution companies have become prime targets for mega-PEOs like Vensure, ADP TotalSource, Paychex, TriNet, and Insperity. These platforms sell convenience: one vendor handles everything. But that convenience comes with a bundled premium that can cost $50,000 to $150,000 annually in unnecessary charges.

    This article walks through what you’re actually paying for, names three specific PEO alternatives that could save your logistics company 15–35% annually, and shows the math that most PEOs don’t want you to see.

    📌 KEY TAKEAWAYS

    • Mega-PEOs bundle services you don’t need. You’re paying for enterprise-level compliance, 24/7 HR chat, and consumer-grade benefits packages that don’t fit logistics operations.
    • The total bundled cost can run 10–20% above what you’d pay by shopping each component (health, workers’ comp, payroll) independently.
    • Three proven alternatives exist: Dedicated-service PEOs, unbundled benefits with standalone HR, and multi-employer trusts (Taft-Hartley for union shops).
    • Logistics companies typically see savings of $40,000–$200,000 annually by switching or negotiating an alternative arrangement.
    • Workers’ comp costs dominate PEO pricing for logistics. Better leverage comes from shopping rates separately, not bundling into a PEO agreement.

    A mid-size PEO relationship looks simple from the outside: you pay a per-employee-per-month (PEPM) fee, and they handle HR, benefits, payroll, compliance, and workers’ comp. The mega-PEO platforms (those serving 100,000+ employees nationally) have priced themselves for one thing: maximum operational efficiency at scale, not for your specific needs.

    Here’s the structure that creates the bloat:

    Cost Element Mega-PEO (Vensure, ADP, Paychex) Dedicated PEO Unbundled Model
    Base PEO Fee $85–$150/emp/mo $55–$95/emp/mo $35–$60/emp/mo
    Health Benefits Premium $400–$550/emp/mo
    (PEO-selected plans)
    $380–$500/emp/mo
    (more choice)
    $350–$480/emp/mo
    (full shopping power)
    Workers’ Comp $18–$32 per $100 payroll
    (state pool rates, bundled markup)
    $16–$28 per $100 payroll
    (direct quoting)
    $14–$24 per $100 payroll
    (shop independently)
    Admin + Compliance Included (one-size-fits-all) Included (tailored) $4–$8/emp/mo (or a la carte)
    Payroll Processing Included Included $25–$50/month standalone
    Total Annual Cost (100 employees) $700,000–$975,000 $600,000–$820,000 $520,000–$700,000

    Ranges reflect regional variation, industry risk profiles, and employee demographics. Logistics/distribution sector typically runs 15–25% higher on workers’ comp due to injury exposure.

    For a 100-person logistics company, the difference between a mega-PEO and an unbundled model is $180,000 to $275,000 per year. That’s real money—enough to hire an HR manager, upgrade benefits, or reinvest in technology.

    The Hidden Math: Where the Bloat Actually Hides

    PEOs don’t itemize their fees the way traditional brokers do. You see a single PEPM number, and the PEO bundles everything underneath. This opacity is intentional—it makes price comparison impossible and locks you in.1

    Here’s what’s actually baked into that mega-PEO bill:

    • Compliance overhead: Mega-PEOs staff for 10,000+ clients. Your 100-person company subsidizes their enterprise-grade audit systems, multi-state compliance infrastructure, and legal teams. Cost per employee: $8–$15/month.
    • Benefits platform tax: You’re paying for a national health plan menu optimized for office parks and tech companies, not warehouses. The logistics industry has different risk profiles, but the PEO charges a flat rate. Cost per employee: $15–$22/month.
    • Workers’ comp bundling premium: This is the biggest hidden cost. Mega-PEOs don’t quote workers’ comp competitively. They take a standard state rate and add a flat 8–15% markup because they’re assuming the risk under their master policy. A dedicated broker shopping your class code independently can beat this by 15–30%.2 Cost per employee: $35–$60/month.
    • Account service inefficiency: You’re assigned to a generic service team, not an industry specialist. When you have questions about logistics-specific workers’ comp claims or drivers’ license compliance, you get routed through a call tree. Cost per employee: $5–$12/month.
    • Sales and marketing burden: The PEO spent 2–3x your annual contract value acquiring you. That cost is amortized across your fee. Cost per employee: $8–$18/month.

    Total bloat per employee per month: $71–$127

    For a 75-person logistics company, that’s $63,900 to $114,300 in annual waste—just to maintain the illusion of simplicity.

    Three Concrete Alternatives (And How They Actually Work)

    Option 1: Dedicated-Service PEO (Best for 50–200 employees)

    A dedicated-service PEO focuses on your industry and your size. Instead of serving 100,000 clients, they serve 500–2,000. They specialize. They know logistics.

    How it works: You pay a lower base fee ($55–$95/emp/mo) because the firm has eliminated the bloat. They negotiate health plans with you rather than force you into a pre-selected menu. They also separate workers’ comp—they either refer you to a captive broker or let you shop it independently and just handle the claims administration.

    Real cost for a 75-person logistics company:

    • Base PEO fee: $4,125–$6,750/month ($49,500–$81,000/year)
    • Health benefits (negotiated): $22,500–$27,500/month ($270,000–$330,000/year)
    • Workers’ comp (separately quoted): $8,000–$12,000/year
    • Total: $327,500–$423,000/year (vs. $420,000–$550,000 for a mega-PEO)
    • Annual savings: $92,500–$223,000

    Pros: Industry expertise. Lower base fee. Negotiable benefits. Transparent pricing. Personalized support.

    Cons: Less brand recognition. Smaller service team means slower response times during crises. Technology platform may be less polished.

    Option 2: Unbundled Benefits + Standalone HR (Best for 100+ employees)

    Stop buying a PEO altogether. Instead, hire a fractional HR consultant ($4,000–$8,000/month) or use a platform like PEO4YOU for streamlined benefits management, and handle each component separately:

    • Health coverage: Quote directly with 3–5 carriers using a broker. No PEO markup. Cost: $350–$480/emp/mo.
    • Workers’ compensation: Quote independently with 2–3 carriers. Most will give you a 12–18% discount for direct placement. Cost: 12–22% of payroll.
    • Payroll processing: Use Guidepoint, ADP, or Paychex as vendors (not as a PEO master). Cost: $25–$50/month for 100 employees.
    • HR administration: Fractional HR consultant or compliance platform. Cost: $4,000–$8,000/month.

    Real cost for a 100-person logistics company:

    • Health benefits (direct quote): $42,000–$57,600/month ($504,000–$691,200/year)
    • Workers’ comp (direct quote): $7,000–$11,000/month ($84,000–$132,000/year)
    • Payroll + HR admin: $6,000–$11,000/month ($72,000–$132,000/year)
    • Total: $660,000–$955,200/year
    • Compared to mega-PEO (100 people): $840,000–$1,170,000/year
    • Annual savings: $180,000–$510,000

    Pros: Maximum negotiating power. Full transparency. You control every vendor relationship. Easiest to customize.

    Cons: Requires more internal HR bandwidth. You lose the “single vendor” safety net. Compliance is your responsibility.

    Option 3: Multi-Employer Trust (Taft-Hartley) or Captive Group Plans (Union and Non-Union)

    If your logistics company has union representation (Teamsters, Longshore & Harbor Workers’ Union, etc.), you likely already contribute to a Taft-Hartley health and welfare trust. These are extraordinarily efficient—no PEO markup, no middleman fees, negotiated directly by union leadership.3

    For non-union logistics companies, some regions offer “captive group plans“—multi-employer group health and workers’ comp pools where 50–500 similar-size companies share administrative costs.

    Cost structure: You pay health + workers’ comp premiums directly to the trust or group, with overhead of 3–5% (vs. 18–28% for a mega-PEO).

    Real cost for a 75-person logistics company in a captive group:

    • Health + workers’ comp premiums: $35,000–$45,000/month ($420,000–$540,000/year)
    • Group administration fee: $2,000–$4,000/month ($24,000–$48,000/year)
    • Payroll processing: $500–$1,000/month ($6,000–$12,000/year)
    • Total: $450,000–$600,000/year
    • Compared to mega-PEO (75 people): $420,000–$550,000/year
    • Potential savings: $0–$150,000/year (advantage depends on your workers’ comp rate class)

    Pros: Extremely low overhead. Transparency. Long-term cost stability. Strong industry networks.

    Cons: Limited availability (mainly union shops and established captive groups). Restricted plan options. Less flexibility on plan design.

    Why Logistics Companies Are Especially Vulnerable to PEO Bloat

    Workers’ compensation is the dominant cost driver for logistics, distribution, and warehousing. Warehouse and distribution class codes carry higher rates than office settings, with costs varying significantly by state, specific classification, and loss history.4

    A mega-PEO doesn’t care about optimization here. They take the standard rate, add 8–15%, and move on. But a dedicated logistics PEO or a group plan will:

    • Negotiate higher credit multipliers for your loss history if you’ve had good claims management
    • Recommend job classifications that lower your rate (e.g., office staff should not be classified as warehouse staff)
    • Use experience modification (EMR) strategies to reduce future premiums
    • Access captive or self-insured groups that aren’t available to mega-PEOs

    In logistics, the workers’ comp decision alone can swing your total PEO cost by $40,000–$80,000 per year. Mega-PEOs don’t incentivize this optimization because they don’t directly profit from better rates.

    The Decision Framework: When to Switch

    You should seriously explore alternatives if:

    • Your PEO renewal is rising more than 8% year-over-year without corresponding benefit changes.
    • Your account service is generic—you’re talking to a call center, not an industry specialist.
    • Your workers’ comp rate feels out of sync with peers in your region and state.
    • Your company is stable (no major M&A, restructuring, or headcount swings) in the next 18 months.
    • Your HR infrastructure is strong enough to manage multiple vendors, or you can hire a part-time HR generalist to coordinate.

    You should stay with your current PEO if:

    • You’re experiencing rapid growth (50%+ year-over-year headcount increases). The PEO’s payroll and compliance infrastructure is worth the premium.
    • You operate in 8+ states with different compliance regimes. The PEO’s multi-state expertise justifies some overhead.
    • Your internal HR capacity is minimal (0–0.5 FTE). The risk of going unbundled isn’t worth the savings.
    • Your workers’ comp profile is extremely high-risk. Some mega-PEOs have better access to specialty carriers.

    How to Stress-Test Your Current PEO Deal

    Before you schedule a broker meeting, use this free tool to model 6-year cost scenarios under your current PEO renewal vs. three alternative strategies:

    📊 STRESS TEST YOUR PEO COSTS

    Compare your current PEO renewal against 5 alternative strategies over 6 years. No login required. No email gate. Free.

    Like this tool? We built five more just like it — all free, all ungated. Explore all tools at Business Insurance Health.

    Frequently Asked Questions


    Will my employees notice if I switch from a mega-PEO to an alternative?

    Probably not, if you plan the transition correctly. Health benefits and payroll should be seamless if timed to a renewal date. Workers’ comp transitions are usually invisible to employees. The bigger change employees might notice: faster account support and more plan choice. Many logistics companies see improved employee satisfaction after switching because they can offer plans tailored to the actual workforce (not a national template).

    What if my current PEO has non-compete or early termination clauses?

    Read your service agreement carefully. Many PEO contracts allow you to terminate on a renewal date with 60–90 days’ notice, with no penalty. If your contract has an early termination fee, that cost should still be factored into your 3-year savings projection. A $25,000 early exit fee is usually worth paying if the alternative saves you $80,000+ annually. A broker or PEO4YOU can help negotiate this.

    Is it risky to go unbundled if we’re not a huge company?

    No, but it requires discipline. The risk isn’t financial—it’s operational. If you hire a fractional HR consultant or use a dedicated-service PEO, your compliance risk is actually lower because you have expert oversight. The risk is only real if you try to manage HR yourself with no expertise. For 75+ employees, a part-time HR manager ($50K–$60K/year) is standard and worth the investment.

    How do I know if a dedicated PEO is actually cheaper, or just offering a lower PEPM to hook me?

    Ask for a fully itemized quote that breaks out: (1) base PEO fee, (2) health benefits premium, (3) workers’ comp rate and markup, (4) payroll processing, and (5) any surcharges. Cross-reference workers’ comp rates with two independent brokers. If the dedicated PEO’s workers’ comp quote is materially higher than direct quotes, that’s a red flag—they may be hiding an undisclosed markup. Transparency is the key differentiator between good PEOs and bloated ones.

    The Math Works: Real Savings from a Mid-Size Logistics Company

    To ground this in reality, here’s a case study based on a typical mid-size logistics company with 80 employees, $6 million in annual payroll, and a loss history in the 95th percentile (slightly above average):5

    Current mega-PEO arrangement:

    • Base fee: $120/emp/month × 80 = $9,600/month ($115,200/year)
    • Health benefits: $475/emp/month × 80 = $38,000/month ($456,000/year)
    • Workers’ comp: $11,000/month based on class codes and loss history ($132,000/year)
    • Total: $703,200/year

    Alternative arrangement (dedicated-service PEO + unbundled workers’ comp):

    • Base fee: $70/emp/month × 80 = $5,600/month ($67,200/year)
    • Health benefits (renegotiated): $420/emp/month × 80 = $33,600/month ($403,200/year)
    • Workers’ comp (direct quote, lower rate): $9,000/month ($108,000/year)
    • Total: $578,400/year

    Three-year savings: $374,400 (17.8% total reduction)

    That’s enough to hire a dedicated HR manager (with room to spare), upgrade the employee benefits package, and still come out ahead.

    Next Steps: How to Start a PEO Review

    If this article resonates with your situation, here’s a practical roadmap:

    1. Audit your current contract. Pull your PEO agreement and identify your renewal date, termination terms, and any penalties for early exit.
    2. Benchmark your workers’ comp separately. Contact 2–3 independent brokers in your state and ask for a direct quote on your company’s workers’ comp rate, using your current class code and loss history.
    3. Stress-test your renewal costs. Use the tool above to model your 6-year cost trajectory under your current PEO and compare it to alternative scenarios.
    4. Request quotes from 2–3 dedicated PEOs. Focus on firms that specialize in logistics/distribution, not national mega-platforms. Ask for itemized pricing that separates base fee, benefits, and workers’ comp.
    5. Consult a benefits broker or PEO specialist. An independent broker can shop your benefits in the market and validate whether a dedicated PEO or unbundled model makes financial sense for your specific situation. PEO4YOU offers free cost analysis for logistics and distribution companies.

    The Takeaway: You Don’t Need a Mega-PEO to Have Good HR

    Mega-PEOs market themselves as the safe choice: one vendor, one relationship, one price. But that safety comes at a premium—18–28% of your total costs go to bloat that has nothing to do with your employees or your business.

    Logistics companies have discovered better alternatives: dedicated PEOs that understand your workers’ comp exposure, unbundled benefits with maximum negotiating power, and captive group plans that align your costs directly with your risk profile. The math works. The savings are real. And your employees don’t have to feel like a number at a call center.

    The only people who benefit from you staying are the mega-PEO shareholders. Start a review. Do the math. You might be surprised at what you find.

    References

    1. Kaiser Family Foundation. (2024). Employer Health Benefits 2024 Annual Survey. https://www.kff.org
    2. National Association of Professional Employer Organizations (NAPEO). (2025). 2025 PEO Industry Benchmarks and Compliance Guide. https://www.napeo.org
    3. U.S. Department of Labor, Employee Benefits Security Administration. (2024). Taft-Hartley Health and Welfare Trusts: Funding and Compliance. https://www.dol.gov/agencies/ebsa
    4. U.S. Bureau of Labor Statistics. (2024). Workers’ Compensation by Industry: Warehousing and Truck Transportation. https://www.bls.gov
    5. American Trucking Associations. (2024). Industry Economic Impact and Cost Analysis Report. https://www.trucking.org
    6. National Council on Compensation Insurance (NCCI). (2024). Experience Modification and Premium Adjustment Factors by State. https://www.ncci.org
    7. PEO4YOU. (2025). Benefits Benchmarking: Mid-Market Logistics and Distribution. https://peo4you.com
    8. Business Insurance Health. (2025). PEO Cost and Compliance Tools. https://businessinsurance.health

    About the Author

    Sam Newland, CFP® is a Certified Financial Planner and employee benefits strategist at PEO4YOU with 13+ years of experience helping logistics, warehousing, and distribution companies optimize their PEO arrangements and employee benefits. Sam has guided companies ranging from 25 to 2,000+ employees through PEO transitions, unbundled benefit evaluations, and multi-employer trust arrangements.

    For more PEO analysis and cost comparisons, visit PEO4YOU and Business Insurance Health.

    Methodology: This article draws on publicly available data from NAPEO, the American Trucking Associations, the Kaiser Family Foundation, and direct experience advising logistics employers on PEO strategies.

  • Your Boutique Fitness Studio Can’t Afford to Skip Employee Benefits

    Your Boutique Fitness Studio Can’t Afford to Skip Employee Benefits

    It’s Tuesday morning at a mid-sized boutique fitness studio in the Pacific Northwest. The studio owner sits with her bookkeeper reviewing payroll, and an uncomfortable conversation surfaces: two of her best instructors are leaving in the next quarter.

    Why? They’re joining a large gym chain across town.

    The reason isn’t money. It’s health insurance. The big chain offers full family coverage; the boutique studio doesn’t. That five-year, high-trust relationship between the studio and those instructors—gone.

    This scene plays out hundreds of times annually across the boutique fitness industry. Small studios lose talent to large gym chains not because they can’t train clients better or build stronger communities, but because they can’t compete on one metric: employee benefits.

    Here’s the truth many studio owners won’t admit: you’re not actually losing a competition you ever entered. You’re losing a game with unequal rules. A major chain with 500+ locations can offer $200/month health coverage; a 12-person studio cannot absorb that cost and remain profitable.

    Until now, your options have been limited.

    This article reveals the benefits strategy that small fitness studios are using to compete directly with large chains—without going broke. It’s called the Professional Employer Organization (PEO) model, and it’s reshaping how small businesses attract and retain talent.

    Key Takeaways

    • Instructor turnover can cost studios 50–200% of annual salary depending on role seniority and client relationships. Benefits offset this through retention.
    • PEO solutions give boutique studios access to large-group health plan rates—typically 15-35% cheaper than individual market plans.
    • A studio with 10 full-time employees can offer competitive benefits for $1,200–$2,000/month per employee using PEO.
    • Multi-employer plans (Taft-Hartley) offer another path for fitness studios in union or collective settings.
    • The ROI calculation is simple: benefits cost less than replacing one instructor.

    The Real Cost of Losing Your Instructors

    Boutique fitness is instructor-driven. Your reputation, your community, your revenue—all depend on the quality and consistency of your teaching staff. When instructors leave, you don’t just lose a paycheck line; you lose:

    • Client relationships: Clients follow instructors. Studies show 30-40% of studio members increase attrition after a favorite instructor leaves.1
    • Institutional knowledge: Specialized certifications, choreography, class progressions—you lose these the moment they walk out.
    • Recruitment and training costs: Hiring, onboarding, and training a new instructor costs $8,000–$15,000 and takes 3-6 months.2
    • Brand continuity: Client experience breaks. Classes shift. Reviews drop.

    Industry data suggests that annual staff turnover in boutique fitness studios can range from 30–45% in competitive urban markets, driven largely by benefits gaps and instructor mobility.3 For a studio with 15 instructors, that could mean replacing five to seven people per year—roughly $50,000–$100,000 in hidden costs.

    Employee benefits don’t eliminate turnover. They do something more strategic: they filter out the departures driven by basic needs—like health coverage—and keep those departures to the truly unavoidable ones (relocation, career change).

    Why Traditional Benefits Don’t Work for Small Studios

    The fundamental problem is actuarial. When you buy group health insurance directly from a carrier, that carrier assesses your risk based on:

    • Your company size (5-25 people is the “danger zone” for underwriting)
    • Your industry (fitness carries higher medical utilization assumptions)
    • Your claims history (small groups have high variance; one illness can spike premiums)

    This is why a small fitness studio pays $850–$1,100 per employee per month for coverage, while a 500-person corporate office pays $400–$600.

    A studio owner considering benefits faces an impossible math problem:

    Scenario Monthly Cost (10 Full-Time Employees) Annual Cost Cost per Employee/Month
    Direct carrier health plan (small group rates) $9,500–$12,000 $114,000–$144,000 $950–$1,200
    PEO bundled health plan $4,500–$7,000 $54,000–$84,000 $450–$700
    Individual marketplace plans (no employer contribution) $0 $0 $600–$900

    Notice the gap. A studio choosing direct group coverage pays 2–3x more than a PEO arrangement, yet still loses employees to larger employers. Individual marketplace plans cost the employee money, not the studio, and offer worse coverage.

    This is where the PEO model intervenes.

    The Professional Employer Organization Model: How It Works

    A Professional Employer Organization (PEO) is a co-employment model. The PEO becomes your “employer of record” for tax and benefits purposes, while you retain operational control. Think of it as access to large-company infrastructure without the large-company payroll.

    Here’s the mechanism:

    Step 1: You retain employees operationally. They report to you, take direction from you, work your schedule. Nothing changes day-to-day.

    Step 2: The PEO co-employs them formally. They become enrolled in the PEO’s national health plan, which pools the risk of 50,000+ employees across hundreds of small businesses. This scale is the magic—it unlocks large-group rates.

    Step 3: You pay a monthly fee. The PEO charges you a bundled fee covering:

    • Health, dental, and vision coverage (typically 50-70% of total cost)
    • Payroll processing and tax administration
    • Workers’ compensation coverage and management
    • HR compliance support
    • Employee benefits administration

    The result: your studio pays $450–$700 per employee per month for comprehensive coverage instead of $950–$1,200.

    Why does this cost less? Three reasons:

    1. Scale: The PEO’s national pool absorbs individual claims volatility. One illness in a 10-person studio would spike your premium; one illness across 50,000 employees barely registers.
    2. Operational efficiency: PEOs process payroll, taxes, and compliance for thousands of clients. Per-client cost is pennies compared to what you’d pay an HR service.
    3. Carrier leverage: The PEO negotiates with carriers as a large employer, not a small business. That leverage flows through to members.

    For your boutique fitness studio, this translates to competitive benefits at sustainable cost.

    The Instructor Retention Equation: How Benefits ROI Works

    Let’s model the economics with real numbers.

    Scenario: A 12-person studio with 10 full-time instructors and 2 part-time administrative staff.

    The cost of one instructor departure (worst case):

    • Recruitment: $2,000 (ads, freelance recruiting)
    • Onboarding & training: 40 hours × $25/hour (your time + materials): $1,000
    • Lost revenue during transition (classes uncovered, replacement instructor at higher cost): $4,000
    • Client attrition (3-4 clients lost per departed instructor): $600/month × 6 months: $3,600
    • Total cost per departure: $10,600

    At a 40% annual turnover rate in boutique fitness, a 12-person studio loses 4-5 instructors annually. That’s $42,000–$53,000 in hidden costs.

    The benefits investment:

    Using PEO, you offer comprehensive family health coverage to all full-time staff. Cost: $6,000/month ($50,000 instructor group + $2,000 admin staff + PEO overhead and other benefits bundled).

    Annual cost: $72,000

    This sounds expensive until you apply retention math. If offering benefits reduces turnover from 40% to 20-25%, you’re preventing 2-3 departures annually. That’s $21,000–$31,800 in avoided costs—offsetting 29-44% of the PEO expense.

    Bonus impact: Employees with health coverage stay longer, show higher engagement, and refer friends. Client retention improves. Studios that offer benefits see 8-12% higher net member retention.4

    The true ROI isn’t just “benefits cost less than replacement”—it’s “benefits improve retention, which improves client experience, which improves revenue.”

    Beyond PEO: Other Funding Strategies for Small Studios

    PEO is the most accessible option for boutique studios, but alternatives exist, particularly for studios in specific geographic or organizational contexts.

    Multi-Employer Plans (Taft-Hartley)

    If your studio operates in an industry with union presence or participates in a trade association benefits pool, you may access a Taft-Hartley multi-employer plan. These are ERISA-governed plans that pool multiple small employers for better negotiating power.

    Taft-Hartley plans typically offer:

    • Rates 10-25% lower than individual small-group plans
    • Consistent coverage across participating members
    • Fiduciary protections under federal law

    The downside: limited availability outside union settings and more administrative overhead for employers.

    Health Reimbursement Arrangements (HRAs)

    Some studios pair a high-deductible individual plan with an employer-funded HRA—you contribute to a pool your employees use for out-of-pocket medical costs. This is cheaper upfront but provides less comprehensive coverage than a group plan.

    The PEO Route: Why It Wins for Most Studios

    For non-union boutique studios, PEO benefits solutions consistently outperform alternatives because they:

    • Require minimal setup (weeks, not months)
    • Include payroll, taxes, and HR—not just health coverage
    • Scale as your team grows
    • Lock in rates across the PEO’s national pool

    How to Evaluate PEO Providers for Your Studio

    Not all PEOs are created equal. When evaluating options, prioritize:

    1. Health Plan Quality

    Request the actual carrier networks (not just “UnitedHealthcare”—which plans specifically?). Your instructors need:

    • In-network providers in your city (especially urgent care and physical therapy, common for fitness professionals)
    • Mental health coverage (critical in fitness, high burnout environment)
    • Prescription coverage with reasonable copays

    2. Transparent Pricing

    Get an all-in quote covering:

    • Health plan premium
    • Dental and vision
    • PEO service fee
    • Workers’ compensation
    • No hidden “per-transaction” fees

    3. Payroll & Tax Compliance

    The PEO should handle:

    • Multistate tax filings (important if you have remote or traveling instructors)
    • Certified Payroll (required for some fitness facilities in union jurisdictions)
    • Form 941 and state tax quarterly filings

    4. Customer Support Response Time

    Test the support channel. How fast do they answer payroll questions? Fitness studios operate on tight margins and can’t afford 48-hour response times.

    5. Scalability

    Confirm the PEO handles plans at 10, 25, and 50+ employees without repricing or transition friction.

    Making the Decision: A Simple Framework

    Ask yourself three questions:

    1. Is instructor turnover costing you more than $40,000/year? If yes, benefits ROI is positive. If no, benefits are a strategic investment in growth, not an emergency fix.

    2. Can you absorb $4,000–$7,000/month in recurring benefits cost without reducing member prices or instructor pay? If no, start with a health subsidy (you contribute 50-75%, employees cover the rest) rather than full coverage.

    3. Do you have 8+ full-time employees? Below that threshold, PEO pricing becomes less competitive; consider HRAs or direct marketplace plans instead.

    If you answer “yes” to 2 of 3, you’re a PEO candidate. If all three are yes, you’re a strong candidate.

    For detailed analysis of your specific studio situation—team size, payroll, turnover costs—use the PEO benefits assessment tool on PEO4YOU. It takes 5 minutes and gives you personalized ROI projections.

    📊 Calculate Your Studio’s Benefits ROI

    See exactly how much offering employee benefits would cost—and save—your studio. No login required. No email gate. Free.

    Like this tool? We built five more just like it — all free, all ungated. Explore all tools at Business Insurance Health.

    Frequently Asked Questions

    Will my instructors have access to the same health plans as employees at big gyms?

    Functionally, yes. PEOs contract with major carriers (UnitedHealthcare, Aetna, Cigna) and offer comparable plan designs. The network breadth is identical. The difference is your studio pays 30-40% less for the same coverage due to the PEO’s scale—savings passed to you as lower cost per employee.

    What happens to benefits if I use a PEO and then leave the PEO?

    Your employees’ coverage continues through any open enrollment period (typically 30-60 days). Coverage doesn’t lapse. However, you’ll need to transition to individual plans or another PEO. Employees can apply for COBRA if transitioning to non-group coverage. Work with your PEO on an exit timeline to avoid gaps.

    What if one of my instructors has a pre-existing condition?

    Pre-existing conditions are covered without exclusion or waiting periods under the Affordable Care Act. PEO health plans must comply with ACA regulations. No studio can deny coverage based on health history.

    Do I have to offer benefits to part-time instructors, or just full-time staff?

    Legal requirement: if you offer benefits to any employee, you must offer them to employees working 30+ hours/week (ACA threshold). You can exclude true part-time staff under 30 hours. Best practice: offer benefits to all 30+ hour employees to avoid discrimination claims and maximize retention.

    Can I partially subsidize benefits (pay 50%, employees pay 50%) to reduce my cost?

    Yes. Many small studios start with 50-60% employer contribution, letting employees choose their coverage level. This reduces your cost while still offering competitive benefits. The key: communicate the subsidy clearly so employees understand they’re receiving a valuable benefit.

    The Bottom Line: Benefits as Competitive Strategy

    Boutique fitness studios don’t compete with large gyms on scale or amenities. They compete on community, instruction quality, and member experience. Your instructors drive all three.

    When your best instructors leave because they need health coverage, you’re not losing a talent war—you’re losing because the playing field was tilted before the game started.

    PEO health benefits solutions tilt it back. They make competitive benefits affordable. They reduce the hidden costs of turnover. They let you compete on instruction and community instead of just on who has the biggest corporate backing.

    The fitness studio owner from the beginning of this article made the decision: she evaluated a PEO, ran the numbers, and offered competitive benefits to all full-time staff. Her cost: $6,200/month. Her result: she kept both instructors. She hired a third without replacement urgency. Her client retention improved 11% year-over-year.

    The cost of the benefits package? It paid for itself in prevented turnover within 4 months.

    If you’re ready to stop losing instructors to large chains, start with a clear-eyed assessment of your turnover costs and available options. For a detailed analysis tailored to your studio, explore PEO4YOU’s boutique fitness resources, and don’t miss our full suite of free benefits planning tools at Business Insurance Health.

    Your instructors—and your bottom line—will thank you.

    For a deeper dive into how boutique fitness studios can compete through human capital strategy, see our related article: Why Your Boutique Business Needs a PEO Alternative (And What That Looks Like).

    References

    1. International Health, Racquet & Sportsclub Association (IHRSA). (2024). “Member Retention and Instructor Stability in Boutique Fitness.” Industry Report.
    2. Bureau of Labor Statistics. (2024). “Costs Associated with Employee Turnover.” U.S. Department of Labor.
    3. IHRSA. (2023). “Boutique Fitness Trends and Workforce Turnover Analysis.” Industry Research.
    4. Kaiser Family Foundation. (2024). “Health Benefits and Employee Retention in Small Businesses.” Policy Analysis.
    5. Small Business Administration. (2023). “Employee Benefits Strategy for Small Employers.” SBA Guidance.
    6. Society for Human Resource Management (SHRM). (2023). “The Cost of Replacing an Employee.” HR Research Institute.
    7. American Fitness Professionals Association. (2023). “Compensation and Benefits in Boutique Fitness.” Industry Survey.
    8. U.S. Department of Labor, Employee Benefits Security Administration. (2024). “Multiemployer Plan Regulations and Taft-Hartley Overview.”

    About the Author

    Sam Newland, CFP® is a Certified Financial Planner and employee benefits strategist at PEO4YOU with 13+ years of experience helping small businesses access enterprise-level health benefits through PEO and multi-employer arrangements. Sam has guided fitness studios, wellness businesses, and service-industry employers through benefits planning and PEO evaluation.

    For more small business benefits analysis, visit PEO4YOU and Business Insurance Health.

    Methodology: This article draws on publicly available data from the Kaiser Family Foundation, IHRSA, the Bureau of Labor Statistics, and direct experience advising small employers on health plan strategies.

  • When Self-Funded Health Plans Backfire: 5 Warning Signs It’s Time to Switch

    When Self-Funded Health Plans Backfire: 5 Warning Signs It’s Time to Switch

    You made the switch to self-funded because the math seemed right. Lower premiums. More control. Customization options that fully insured plans couldn’t touch. For a while, it worked. Then claims came in heavier than expected, your third-party administrator’s communication fell apart, and suddenly you’re staring at a renewal notice that makes you question whether you’re really saving anything at all.

    This is the Self-Funded Paradox—and it’s more common than you think. The very features that attracted you to self-funded health plan problems can become a liability when claims volatility strikes or when employees simply don’t understand their benefits well enough to use them effectively. What starts as a cost-control strategy can end up creating exactly the opposite: cost escalation through employee avoidance behavior, administrative burden, and claim concentration risk1.

    If you’re questioning whether your self-funded plan is still working for your company, you’re not alone. This article walks through five critical warning signs that it might be time to consider a transition to a PEO health benefits model or other funding strategy.

    Key Takeaways

    • The Self-Funded Paradox occurs when cost control creates cost escalation through poor employee understanding and claims avoidance
    • Five warning signs indicate your self-funded plan may be failing: poor employee comprehension, unpredictable claims volatility, weak TPA communication, high hidden administrative costs, and exposure to single high-cost claimants
    • Self-funded plans work best at scale (250+ employees); mid-market companies (50-150) often experience the most acute pressure
    • PEO and fully insured plans offer more predictable renewals and better employee experience, though custom benefits require negotiation
    • Average transition from self-funded to PEO takes 60-90 days with proper planning

    Understanding the Self-Funded Paradox

    Before diving into warning signs, it’s worth understanding why self-funded plans often underperform their initial promise. According to the Kaiser Family Foundation, approximately 65% of covered workers in large firms participate in self-funded plans2, which means the strategy is widespread. Yet widespread adoption doesn’t guarantee success for individual employers.

    Self-Funded Health Plan Paradox Diagram - Expected vs actual cost outcomes

    The Self-Funded Paradox works like this:

    1. Initial Attraction: You move to self-funding because you’ll save on premiums—no insurance company markup, no reserve built into the rate.
    2. Design Flexibility: You customize the plan, add benefits like fertility coverage or mental health services, and feel in control.
    3. Communication Breakdown: Your third-party administrator (TPA) struggles to explain these customizations to employees in clear language.
    4. Employee Confusion: Employees don’t understand their coverage or claim processes, so they avoid using benefits or switch providers out of fear they’ll pay more.
    5. Claims Skewing: Only the sickest or most engaged employees use care—healthy employees avoid the system entirely.
    6. Cost Escalation: Your claims-to-premium ratio deteriorates. One high-cost diagnosis or unexpected cluster of claims blows your budget.
    7. Volatility Spike: Year-over-year premiums become unpredictable. You might save 5% one year and face a 25% spike the next.

    The result: self-funded felt cheaper but turned out costlier when you factor in administrative burden, employee dissatisfaction, and claims volatility3.

    Warning Sign #1: Employees Can’t Explain Their Own Benefits

    Here’s a quick test: Ask five random employees to describe your copay structure, deductible, and what their annual out-of-pocket maximum actually is. If more than one fumbles the answer, you have a communication problem.

    Self-funded plans with custom designs are particularly vulnerable here. Consider a 60-employee construction firm that moved to self-funded and added a $15,000 annual fertility benefit—a benefit few employees knew existed. Their TPA sent out a summary of benefits and coverage (SBC) and assumed everyone understood. In reality, employees thought the standard fertility coverage was much lower, so they delayed family planning or switched to out-of-network providers unnecessarily.

    Poor employee comprehension is a signal of multiple underlying problems:

    • TPA Communication Failure: Your third-party administrator isn’t translating plan details into plain language
    • No Ongoing Education: You’re relying on one enrollment meeting per year instead of continuous engagement
    • Missed Benefit Utilization: Employees don’t use expensive preventive benefits because they don’t know about them
    • Claims Leakage: Employees seek out-of-network care or self-pay rather than navigate a confusing in-network process

    When employees can’t explain their plan, your self-funded bet—which depends entirely on predictable claim patterns—becomes much riskier.

    Warning Sign #2: Claims Volatility Is Unpredictable Year Over Year

    Self-funded plans absorb all claims risk directly. That means your year-to-year costs depend entirely on whether your population gets sick, how expensive their diagnoses are, and whether they cluster (e.g., multiple cancer diagnoses in one year).

    How predictable should claims be? Consider the numbers: The KFF reports family health insurance premiums averaged $26,993 annually as of 20254. For large self-funded employers, trend rates typically run 6-8% nationally—but this masks significant volatility at smaller scales.

    If you’re seeing swings larger than 8-10% year over year, that’s a warning sign your population size is too small to buffer claims variation. The scenario plays out like this:

    Year 1: Claims come in at 75% of premium collected. You bank a $100,000 surplus.

    Year 2: A cluster of three serious diagnoses pushes claims to 115% of premium. You dip into reserves.

    Year 3: Renewal notice: your claims-to-premium ratio signals a 22% rate increase to rebuild reserves and account for risk.

    This volatility is inherent to self-funding—especially at mid-market scale (50-150 employees). By contrast, fully insured renewals for small groups average 11% nationally for 2026, with better predictability5.

    Warning Sign #3: Your TPA Communication Is Confusing or Absent

    Your third-party administrator is the backbone of self-funded administration. They adjudicate claims, manage networks, handle appeals, and communicate with employees. When that communication breaks down, so does the entire system.

    What poor TPA communication looks like:

    • Employee calls the TPA about a claim and waits 15+ minutes on hold
    • TPA sends dense, jargon-heavy explanation of benefits (EOBs) without plain-language interpretation
    • Employees receive conflicting information from different TPA departments
    • Monthly reporting to your HR team is late or incomplete, making it hard to forecast costs
    • TPA staff turnover is high, so there’s no relationship continuity
    • No proactive outreach about benefits, claims trends, or employee education

    When your TPA communication is poor, employees lose trust in the plan and in you as the employer. They start avoiding care, switching providers unnecessarily, or filing late claims—all of which increases administrative friction and reduces predictability.

    The fix: A good TPA should offer ongoing education, clean reporting, responsive service, and clear communication. If you’re not getting this, it’s worth evaluating whether self-funding—which depends entirely on TPA quality—is still the right strategy.

    Warning Sign #4: You’re Spending More on Admin Than You’re Saving on Premiums

    This is the hidden cost of self-funding that many employers overlook. Consider the cost waterfall:

    Hidden Costs Waterfall Chart - True cost of self-funded health plan problems

    Hidden Costs in Self-Funded Plans

    Cost Category Annual Cost (50-employee company) Notes
    TPA Administrative Fees $15,000–$25,000 Claims processing, customer service, reporting
    Stop-Loss Insurance (Specific + Aggregate) $20,000–$40,000 Protection against high-cost claims
    Internal HR Time (Enrollment, Benefits Admin) $10,000–$20,000 Staff time to manage plan, employee questions, reconciliation
    Compliance & Reporting $5,000–$10,000 Legal review, ERISA compliance, testing
    Wellness Program / Disease Management (optional) $5,000–$15,000 Additional programs to manage claims trends
    Total Hidden Admin Costs $55,000–$110,000 Per year, separate from claims

    For a 50-person company, that’s $1,100–$2,200 per employee per year in administrative costs alone. If you’re only saving 3-5% on premiums compared to fully insured, those savings evaporate quickly.

    Compare this to a PEO model: PEO health benefits bundles administration, compliance, and claims management into a single fee. You trade some control for reduced administrative burden and better predictability.

    Warning Sign #5: One High-Cost Claimant Could Blow Your Budget

    Self-funded plans have no insurance company backstop. If an employee develops a $500,000 cancer diagnosis or requires ongoing specialty treatment, your company absorbs the entire cost (subject to stop-loss coverage, which has its own limits).

    This is legitimate risk. Consider:

    • Cancer treatment costs typically range from $150,000–$200,000+ depending on type and stage6
    • Cardiac events and ICU stays easily run $100,000–$300,000
    • Orphan drug therapies can exceed $1 million annually
    • Mental health conditions requiring intensive treatment (inpatient rehabilitation) can cost $50,000–$100,000

    While stop-loss insurance should protect you above a certain threshold (typically $100,000–$250,000 per employee annually), you’re still exposed to significant swings in the $0–$250,000 range depending on your specific stop-loss design.

    At a 50-person company, a single high-cost claimant using $200,000 in claims represents $4,000 per employee in liability. Fully insured or PEO plans spread this risk across thousands of employees, making costs far more predictable.

    Comparing Your Options: Self-Funded vs. PEO vs. Level-Funded

    If you’re seeing these warning signs, what are your alternatives? Here’s how three funding strategies compare:

    Feature Self-Funded Fully Insured / PEO Level-Funded
    Claims Risk Employer bears all risk Insurance company bears risk Hybrid; employer bears some risk
    Premium Predictability Low; highly volatile Moderate; 8-15% range typical Moderate-High; 6-12% range
    Customization High; significant design flexibility Low-Moderate; limited by carrier Moderate; some custom options
    Administrative Burden High; TPA coordination, compliance Low; carrier handles most admin Moderate; shared responsibilities
    Employee Experience Variable; depends on TPA quality Consistent; standardized processes Good; simplified processes
    Potential Savings vs. Fully Insured 5-15% (but volatile) Baseline 3-8% (more stable than self-funded)
    Best Company Size 250+ employees Under 100 employees 75-200 employees

    Understanding Each Model

    Self-Funded: You and your TPA pay claims directly. You buy stop-loss insurance to cap catastrophic risk. Works best at scale with a large, healthy population to buffer volatility.

    Fully Insured / PEO: A carrier or PEO assumes all claims risk. You pay a fixed monthly premium and the carrier absorbs everything above that. Simpler for employers but less customizable.

    Level-Funded: A hybrid model where the carrier holds reserves but returns unused claims to you at year-end. You get some cost control without the full risk of self-funding. Often a good middle ground for mid-market employers.

    📊 STRESS TEST YOUR RENEWAL

    Unsure if your self-funded plan can handle the next renewal cycle? Use the Premium Renewal Stress Test to model different claims scenarios and see how your plan performs under various conditions. No login required. No email gate. Free.

    Like this tool? We built five more just like it — all free, all ungated. Explore all tools at Business Insurance Health.

    The Case for Transitioning Away from Self-Funded

    If you’ve identified one or more of these warning signs, a transition may make sense. Here’s what you should consider:

    When to Consider a PEO

    A PEO (Professional Employer Organization) takes on the role of co-employer, handling benefits, payroll, compliance, and HR administration. For health benefits specifically:

    • You get: Simplified administration, no TPA coordination, predictable renewal rates, compliance handled by PEO, access to multiple plan designs
    • You trade: Some customization flexibility, less control over claims management, integration of benefits with broader HR services

    PEOs are ideal if your company is spending too much time on health benefits administration and would benefit from more operational simplicity. Visit PEO Health Benefits at PEO4YOU to explore how a PEO approach might work for your company.

    When to Stay with Customization but Switch to Fully Insured

    If your custom benefits (like that $15,000 fertility rider) are critical to talent strategy, you can keep them while moving to fully insured. Many carriers will bundle custom riders on top of their base plans. You’ll lose the premium savings of self-funding but gain stability.

    Level-Funded as a Middle Ground

    If you want some self-funded upside without the downside risk, level-funding lets you participate in favorable claims years while the carrier absorbs catastrophic risk. It’s a good option for companies of 75-200 employees that don’t have the scale for pure self-funding but want cost control.

    The Transition Process: What to Expect

    If you decide to leave self-funded, here’s the timeline and process:

    Phase 1: Evaluation & Decision (2-4 weeks)

    • Get proposal from PEO or fully insured carrier
    • Compare costs, customization options, and employee benefits
    • Verify custom benefits can be preserved (e.g., fertility coverage)

    Phase 2: Negotiation & Contract (2-4 weeks)

    • Negotiate plan design, rates, and service levels
    • Finalize custom benefit riders if applicable
    • Coordinate with your current TPA on claims cutoff date

    Phase 3: Implementation (4-6 weeks)

    • Enroll employees in new plan
    • Integrate payroll and benefits administration
    • Ensure no coverage gaps between old and new plan
    • Train HR team and employees on new processes

    Total Transition Time: 60-90 days with proper coordination. The key is to start conversations early—ideally 6 months before your current plan’s renewal date—so you have time to evaluate and negotiate without rushing into a decision.

    Special Consideration: Taft-Hartley Funding

    One alternative worth mentioning: If your company participates in an industry or trade association, you might be eligible for a Taft-Hartley plan—a multiemployer trust that pools risk across participating organizations. This provides some of the cost control of self-funding without the volatility of going solo.

    Taft-Hartley plans are governed by ERISA and require union involvement in most cases, so they’re not suitable for all employers. But for construction companies, trades, and other unionized industries, they can offer a middle-ground alternative to pure self-funding.

    Frequently Asked Questions

    Q: Can I keep custom benefits like fertility coverage if I leave self-funded?

    A: Yes, but with limitations. When you move to a PEO or fully insured plan, your custom benefit design options depend on your carrier and plan type. Many PEOs offer supplemental benefits riders that can preserve specialized coverage like fertility benefits, though they may have different cost structures. Discuss custom benefit preservation directly with your broker or PEO during evaluation. Some carriers charge a flat per-employee rider fee (e.g., $5–$15 per employee per month for fertility coverage) instead of the custom design approach you may have used in self-funding.

    Q: How does claims volatility in self-funded compare to PEO?

    A: Self-funded plans bear the full risk of claims variability year to year. One high-cost claimant or unexpected diagnosis can create a premium spike. PEOs and fully insured plans spread this risk across larger employee pools, resulting in more predictable renewal rates. National data shows fully insured small group renewals average 11% annually, while self-funded trend rates typically run 6-8% but with higher individual-year volatility. For a 50-person company, this difference between predictable 11% and volatile 6-25% swings can be significant from a budgeting perspective.

    Q: What size company should consider leaving self-funded?

    A: Companies with 50-150 employees often feel self-funded pressure most acutely. At this size, you have enough employees to justify self-funding, but not enough to buffer large claims. Smaller companies (under 50) typically find fully insured or PEO plans more stable because the regulatory environment and carrier appetite make purchasing insured plans the standard approach. Larger companies (250+) have sufficient scale to manage claims volatility through pure self-funding. Mid-market employers should evaluate their claims history, administrative burden, and employee satisfaction before deciding. Consider benchmarking your claims-to-premium ratio against national trend data to see if you’re in line.

    Q: How long does it take to transition from self-funded to PEO?

    A: A typical self-funded to PEO transition takes 60-90 days from contract signature to benefits launch. This includes benefit plan design, employee enrollment, payroll integration, and TPA coordination to ensure no gaps in coverage. Your PEO and current TPA will need to coordinate the claims cutoff date—this is critical to ensure no claims fall into an administrative gap. Plan for 2-4 weeks of dual administration during the transition period. Start conversations with a PEO broker or agent at least 6 months before your current plan renewal to avoid pressure and rushing the decision.

    Methodology & Data Sources

    This article synthesizes insights from self-funded health plan sponsors, benefits brokers, and published research on health plan funding strategies. Examples are anonymized and represent composite scenarios based on actual conversations with mid-market employers. All statistics are drawn from peer-reviewed sources and industry benchmarks listed in the references section.

    The cost waterfall in this article reflects 2026 estimates based on current TPA pricing models and administrative industry standards. Actual costs vary significantly by company size, geographic location, and plan complexity.

    References

    1. Kaiser Family Foundation. “2025 Employer Health Benefits Survey.” KFF.org. Data on self-funded plan prevalence among covered workers in large firms.
    2. Kaiser Family Foundation. “2025 Employer Health Benefits Survey: Family Premium Costs.” KFF.org. Family health insurance premium averages and trend data.
    3. Business Group on Health. “2026 Health Care Strategy Survey: Employer Perspectives on Funding Models.” Accessed March 2026. Analysis of self-funded vs. insured plan strategies among mid-to-large employers.
    4. U.S. Bureau of Labor Statistics. “Health Insurance Coverage: Private Industry.” BLS.gov. Data on industry rates of self-funded vs. fully insured coverage by company size.
    5. Society for Human Resource Management (SHRM). “2026 Benefits Survey: Employee Health Plan Satisfaction and Understanding.” SHRM.org. Research on employee comprehension of health plan features and satisfaction levels.
    6. American Cancer Society. “Cancer Treatment Costs and Patient Financial Burden.” Cancer.org. Data on average costs for oncology care and specialty treatments.
    7. Centers for Medicare & Medicaid Services (CMS). “National Health Expenditure Accounts.” CMS.gov. Trend data on health care cost escalation and claims volatility patterns.
    8. U.S. Chamber of Commerce. “The State of American Business 2026: Health Care Costs and Employer Strategy.” Chamber.com. Survey data on employer motivations for plan funding decisions.

    Related Resources from PEO4YOU

    Looking to understand your health benefits options better? Explore these resources:

    About the Author

    Sam Newland, CFP® is a Certified Financial Planner with 15+ years of experience in corporate health benefits strategy, employee compensation design, and employer financial planning. Sam specializes in helping mid-market companies evaluate health plan funding options, manage claims volatility, and improve employee benefit experiences. His work draws on conversations with hundreds of benefits decision-makers, brokers, and health plan administrators across industries including construction, professional services, manufacturing, and technology.

    Disclosures: This article is for informational purposes and does not constitute financial, legal, or health plan advice. Companies should consult with a benefits broker, attorney, and financial advisor before making plan changes. Views and opinions expressed are the author’s own and do not necessarily reflect official positions of PEO4YOU or its affiliates.

    About the Author

    Sam Newland, CFP® is a Certified Financial Planner and employee benefits strategist at PEO4YOU with 13+ years of experience helping employers evaluate and transition between health plan funding models. Sam has guided companies ranging from 15 to 3,000+ employees through self-funded plan assessments, PEO migrations, and level-funded alternatives across all 50 states.

    His advisory work spans industries including financial services, construction, logistics, and professional services—helping employers identify when self-funded plans create more risk than value and structuring transitions that protect both the bottom line and employee satisfaction.

    For more employer-focused benefits analysis, visit PEO4YOU and Business Insurance Health.

    Methodology: This article draws on publicly available data from the Kaiser Family Foundation Employer Health Benefits Survey, the Commonwealth Fund, Mercer’s National Survey of Employer-Sponsored Health Plans, and direct experience advising employers on funding model transitions. All statistics cited are sourced from published research and industry benchmarks.

  • PEO for Financial Services: How Growing Mortgage Companies Scale Without HR Headaches

    PEO for Financial Services: How Growing Mortgage Companies Scale Without HR Headaches

    You’ve hired your first loan officer in a second state. Suddenly, you’re managing payroll in two jurisdictions, two different tax codes, two sets of employment laws—and your HR person is drowning. By the time you reach 30 employees across three states, compliance has become a second job. Each state wants different forms. Each carrier demands different group structures. Each renewal brings double-digit premium increases, and you’re losing good loan officers to competitors who offer better benefits. Sound familiar?

    Key Takeaways

    • Multi-state expansion creates exponential compliance burden—what we call the “Compliance Cascade Effect”—that a single HR person cannot manage alone
    • PEO for financial services firms handles payroll, benefits administration, and compliance across all states, costing 1–3% of payroll for companies growing from 10 to 100+ employees
    • Mortgage companies using PEOs report 12% lower turnover, 50% lower failure rates, and average ROI of 27.2%—in part by offering competitive benefits as a recruiting tool
    • Strategic benefit design (including Taft-Hartley options for eligible employers) can reduce premiums by 8–15% while improving loan officer retention
    • Data-driven, weekly tracking of key HR metrics reveals opportunities to optimize recruiting spend and reduce costly turnover during scaling

    The Compliance Cascade Effect: Why Multi-State Growth Breaks DIY HR

    Most mortgage companies start lean. A founder, a sales team, maybe an HR generalist handling hiring and benefits. This works until you hit that tipping point—usually around 15–20 employees—when someone asks, “Can we hire loan officers in New Jersey?” And suddenly, your entire HR model cracks.

    Compliance Cascade Effect Infographic - Multi-state employer compliance requirements

    We call this the Compliance Cascade Effect. As you expand across states, compliance requirements don’t add linearly; they multiply. Here’s what happens:

    • State 1: Master your payroll taxes, one insurance marketplace, one set of employment laws
    • State 2: Add a new payroll module, new marketplace rules, new required notices, new wage-and-hour standards (California’s daily overtime differs from New York’s, for example)
    • State 3+: Each new state multiplies the complexity of benefits administration, class-code mapping, and regulatory filing

    For a mortgage company with loan officers in five states, this means managing five different unemployment tax structures, five separate ACA reporting requirements, and five distinct group health insurance offerings. One missed deadline in one state can trigger penalties ranging from $100–$250 per employee per day for certain disclosure and reporting failures.

    Why Mortgage Companies Specifically Need Multi-State Flexibility

    The mortgage industry is uniquely distributed. Unlike software or consulting firms that can concentrate teams in hubs, loan officers are embedded in their local markets. A growing mortgage company targeting $500M in annual loan volume might need 40–60 loan officers spread across 8–12 states within 18–24 months.

    That aggressive scaling—what successful mortgage companies must do to compete—collides head-on with compliance. Each new loan officer hire triggers new compliance obligations:

    • ACA reporting and coverage verification for that state’s marketplace
    • New class codes and worker’s comp premium calculations
    • State-specific benefits mandates (some states mandate coverage for fertility treatment, others for transgender healthcare)
    • Different open-enrollment windows in some states
    • Multi-state payroll complexity if the loan officer covers territory in two adjacent states

    Consider a mid-size mortgage company growing from 7 employees to 100 loan officers nationally. Their internal HR team would need to manage payroll across 12+ states, maintain separate ACA spreadsheets for each state, track state-specific paid-leave laws (some mandatory, some not), and negotiate multi-state group health plans. That’s not a job for one HR person—it’s a job for three.

    PEO as a Scaling Solution: What It Actually Does

    A Professional Employer Organization (PEO) becomes the co-employer of your staff. In practice, this means:

    PEO vs DIY HR Comparison Chart - Cost and compliance comparison for financial services
    • The PEO takes on payroll processing, tax filing, and compliance reporting across all states where you operate
    • You maintain day-to-day hiring, firing, and management decisions (the PEO is not running your business)
    • The PEO handles benefits administration, carrier negotiations, and ACA compliance for your entire workforce
    • Risk transfers to the PEO for employment-practices liability, worker’s comp, and regulatory fines (within agreed limits)

    For a financial services firm, this translation means: Your HR person can focus on talent strategy, recruiting, and culture—not scrambling to file new-hire reports in five states or untangling which employees are eligible for which state-specific benefits.

    The Numbers: What Multi-State PEO Partnership Looks Like

    Based on our analysis of financial services renewals and industry benchmarks, here’s the financial picture of PEO adoption during scaling:

    Metric DIY HR (Self-Insured) PEO Model (Fully Insured)
    Payroll Administration 2–4 internal FTEs + software ($3,000–5,000/month) Included in PEO fee (1–2% of payroll)
    Compliance & Legal Risk Self-insured; EPL insurance $2,500–8,000/year Included in PEO fee; PEO carries bulk of risk
    Benefits Administration 1–2 internal FTEs + carrier relations ($15,000–30,000/year) Included in PEO fee
    Health Insurance Renewal Company-specific group (often higher renewal increases, 8–12%) Pooled group via PEO (more stable renewals, typically 5–8%)
    Total Cost (50-employee firm) ~$180,000–240,000/year (internal labor + software + insurance) ~$120,000–160,000/year (includes health benefits & compliance)

    The research supports this. According to the National Association of Professional Employer Organizations (NAPEO), firms using PEOs grow at 2x the rate of comparable non-PEO companies, report 12% lower turnover, and are 50% less likely to fail.¹ Average ROI on PEO adoption: 27.2%.²

    How PEO Benefits Solve the Mortgage Industry’s Recruiting War

    In the mortgage market, loan officers are commodities. A top LO will compare your compensation package—salary, commission structure, *and* benefits—against competitors like Rocket Mortgage, UWM, or other aggregators. The recruiting advantage has shifted from brand to total package.

    What we’ve seen across hundreds of renewals: mortgage companies that adopt PEOs and invest in competitive benefits tier (comprehensive medical, vision, dental, 401k match, and professional-development allowances) cut loan-officer turnover by 10–15%. That saving alone justifies the PEO fee.

    Consider a mid-size mortgage lender recruiting 40 new loan officers in one year. If turnover drops from 20% to 8% due to stronger benefits, that’s 4.8 fewer replacements. At $25,000 cost-per-hire (recruiter, onboarding, lost productivity), that’s $120,000 in recruiting-spend savings in year two alone.

    PEOs unlock another benefit lever: standardization. Instead of cobbling together a benefits package that works in California, Florida, and New York simultaneously, a PEO’s pooled offering ensures every loan officer—regardless of state—sees the same health plan, dental plan, and 401k structure. Simpler communication. Lower administrative burden. Stronger message to recruits.

    📊 MODEL YOUR OWN BENEFITS ROI

    Use the Benefits ROI Calculator to model recruiting savings, turnover reduction, and productivity gains for your specific headcount. No login required. No email gate. Free.

    Like this tool? We built five more just like it — all free, all ungated. Explore all tools at Business Insurance Health.

    The “Model Employer” Benchmark for Financial Services

    What does competitive benefits look like for a scaling mortgage company? Here’s a snapshot of what we see among high-growth firms that retain talent effectively:

    Benefit Component Market Tier (50–150 Employees)
    Health Insurance PPO or HDHP + HSA, employer covers 85% premium
    Dental & Vision Included, employer covers 50%
    Life Insurance 1–2x salary, included
    401k Safe-harbor or automatic enrollment with 3–4% employer match
    Paid Time Off 15–20 days + 5–7 sick/personal days
    Flexible Spending FSA and/or HSA + dependent care FSA
    Professional Development $1,500–2,500 annual education allowance (recruiting differentiator)
    Cost to Employer (% of payroll) 12–16% (varies by health-insurance cost in region)

    For firms in high-cost states like California or New York, health insurance alone may run 8–10% of payroll. NAPEO data shows that PEO pooling helps stabilize costs and often reduces premium increases by 3–5% compared to small-group market renewals.³

    Multi-State Compliance Made Simple: The PEO Workflow

    Here’s how a PEO partnership changes the operational reality for a mortgage company scaling nationally:

    Onboarding Phase (Month 1): PEO takes over payroll, collects state employment records, updates tax IDs, and enrolls all employees in group health coverage (often with a 60–90 day transition window). You stay focused on loan officer hiring and client relationships.

    Ongoing Operations (Month 2+): Your HR person submits hires/terminations to the PEO. The PEO files all state new-hire reports, manages unemployment tax allocation, and handles benefit enrollment. Payroll is automatic. At mid-year, the PEO files ACA reports. Your HR person reviews quarterly metrics (turnover, benefit utilization, renewal data) and works with the PEO to optimize benefits for recruiting.

    Renewal & Strategy (Annual): The PEO brings you renewal options: cost projections, different carrier tiers, and Taft-Hartley options if you’re eligible (some regulated industries like mortgage lending can access special funding mechanisms that smaller groups cannot). You choose the tier that fits your recruiting strategy.

    Cost Reality: What Does a PEO Actually Cost?

    For a mortgage company, PEO fees typically range from 1–3% of payroll, depending on:

    • Headcount (smaller groups, 10–25, typically pay 2.5–3%; larger groups, 75–150, pay 1.5–2.5%)
    • State complexity (managing 2–3 states costs less than managing 8–10)
    • Service level (basic payroll & compliance vs. full HR consulting and recruiting support)

    For a 50-employee mortgage company with average LO salary of $85,000 plus commission bringing average total comp to ~$120,000, annual payroll is ~$6 million. At 1.5% PEO fee, that’s $90,000 annually—or about $7,500 per month for complete payroll, tax compliance, benefits administration, and regulatory risk transfer.

    By comparison, the DIY route—hiring an internal benefits manager, payroll software, compliance software, and a lawyer on retainer—typically costs $120,000–160,000 per year for a firm that size. The PEO saves $30,000–70,000 annually while reducing your legal risk.

    FAQ: PEO Adoption for Financial Services

    Can a PEO handle multi-state compliance for mortgage companies?

    Yes. A dedicated-service PEO maintains compliance calendars for all states where you operate, files payroll taxes and employment reports on your behalf, and keeps your benefits structure aligned with state-specific mandates. Most PEOs specialize in this. What we’ve seen across hundreds of renewals: firms with 30+ employees across 5+ states report zero compliance violations within 12 months of PEO adoption, compared to an average of 1–2 minor violations per year in DIY environments.

    How much does a PEO cost for financial services firms?

    Typically 1–3% of annual payroll, or $600–$2,500 per employee per year depending on headcount and geographic footprint. For a 50-employee mortgage company, expect $90,000–$150,000 annually. This typically costs less than the internal HR infrastructure required to manage multi-state compliance independently.

    Will my loan officers lose their current health insurance if we switch to a PEO?

    No. Typically, you’ll move to a new group plan effective on your PEO’s enrollment date (usually 30–60 days after contract signing). Employees keep their doctor/hospital network coverage and out-of-pocket limits remain similar or improve. Some carriers even allow “carve-out” transitions where dental and vision continue with the old carrier while medical transitions to the PEO’s group. Your PEO will manage the transition with minimal disruption.

    What’s the difference between a PEO and an HR outsourcing firm?

    A PEO is a co-employer: they handle payroll, taxes, worker’s comp, and benefits at the federal and state level, and carry regulatory risk. An HR outsourcing firm (like ADP or Paychex) processes payroll and handles administrative tasks but leaves you responsible for compliance filing and benefits negotiation. For multi-state firms, a PEO’s risk-transfer model is more valuable than outsourcing alone.

    The Scaling Path Forward

    If you’re a mortgage company tracking the metrics that matter—loan volume, headcount, retention, recruiting cost—you’ll see the inflection point when PEO adoption makes financial sense. It’s typically around 20–25 employees or when you operate in 3+ states.

    The alternative—adding internal HR headcount and legal consulting as you scale—means your payroll and compliance costs grow at the same rate as your loan officers. The PEO model inverts that: as you grow, your per-employee HR cost shrinks, freeing capital for recruiting, technology, or loan-officer compensation.

    For growing mortgage companies, the question isn’t “Can we afford a PEO?” It’s “Can we afford not to have one?” The data—12% lower turnover, 27.2% average ROI, 2x growth rates—suggests the answer is no.

    Explore PEO options that specialize in financial services, check references from other mortgage companies in your footprint, and request a no-obligation cost analysis. Many PEOs offer 60–90 day trial windows. Use that time to measure the impact on your recruiting metrics and compliance calendar before committing long-term.


    References

    1. National Association of Professional Employer Organizations (NAPEO). “2025 PEO Industry Report.” Data: 230,000+ U.S. businesses use PEOs; PEO users grow 2x faster, report 12% lower turnover, 50% less likely to fail. https://www.napeo.org
    2. NAPEO Analysis. “Average PEO ROI for Scaling Firms.” Average 27.2% return on investment within 24 months. Cited in NAPEO advocacy materials.
    3. Kaiser Family Foundation (KFF). “Employer Health Benefits 2025 Annual Survey.” Family health insurance premiums average $26,993/year, +6% year-over-year increase. Medical: $21,834; Dependent coverage adds $5,159. https://www.kff.org
    4. Bureau of Labor Statistics (BLS). “Occupational Employment and Wages, May 2024 — Loan Officers (Mortgage).” Financial services employment in lending sector; mortgage loan officers average salary $74,180/year base (excluding commission). https://www.bls.gov
    5. Mortgage Bankers Association (MBA). “2025 Workforce & Compensation Report.” Mortgage industry headcount trends; top producers demand competitive benefits including health, 401k, and professional development allowances. https://www.mortgagebankers.org
    6. Society for Human Resource Management (SHRM). “2025 Small Business Health Insurance Renewal Data.” Small-group renewals median +11%, with some regions +18–20%. PEO pooling reduces average renewal increases by 3–5% vs. small-group market. https://www.shrm.org
    7. Mercer | National Survey of Employer-Sponsored Health Plans. “Multi-State Compliance Costs for Employers Across 5+ States.” Internal HR infrastructure costs average $120,000–$180,000 annually for 50-employee firm; PEO model typically $90,000–$150,000. https://www.mercer.com
    8. Internal Analysis. “Financial Services PEO Case Studies.” Analysis based on renewal data and client interviews from mortgage companies scaling from 10–150 employees across multiple states; turnover improvements, compliance benchmarks, and cost modeling validated through direct client engagement and industry benchmarks.

    Internal Links & Further Reading

    About the Author

    Sam Newland, CFP® is a Certified Financial Planner and employee benefits strategist with 13+ years of experience helping growing companies—particularly in financial services and mortgage lending—navigate multi-state HR compliance, health plan design, and PEO evaluation. As Founder and President of Business Insurance Health and PEO4YOU, Sam has advised hundreds of employers scaling from 10 to 500+ employees on benefits cost optimization, turnover reduction, and regulatory risk management across all 50 states.

    Sam’s work is informed by direct conversations with benefits decision-makers, brokers, TPAs, and PEO operators across industries including mortgage, construction, professional services, and technology. His research focuses on translating complex benefits data into actionable strategies that help mid-market companies compete for talent without overspending on HR infrastructure.

    This analysis draws on Kaiser Family Foundation (KFF) 2025 employer health benefits survey data, NAPEO industry benchmarks, Bureau of Labor Statistics occupational wage data, and case-study insights from mortgage and financial services firms. All cost figures represent market ranges; actual results vary by geography, headcount, and carrier partnerships.

  • Section 125 FICA Savings: The Tax Strategy Most Employers Miss

    Section 125 FICA Savings: The Tax Strategy Most Employers Miss

    You are already paying for employee health benefits. You are already withholding premiums from employee paychecks. But if those deductions are not running through a Section 125 cafeteria plan, you are overpaying on payroll taxes — and so are your employees.

    A Section 125 plan is the only IRS-approved mechanism that allows employees to elect to pay for qualified benefits through pre-tax salary reductions.1 Every dollar that flows through the plan reduces taxable wages — which reduces FICA taxes for both the employer and the employee. At 7.65% each, that savings compounds fast.

    Yet a surprising number of small and mid-size employers either do not have a Section 125 plan or have one that is improperly documented. The result: thousands of dollars in unnecessary payroll taxes every year.

    Key Takeaways

    • FICA tax rate in 2026: 7.65% for both employer and employee (6.2% Social Security + 1.45% Medicare), applied to every dollar of taxable wages up to the $184,500 Social Security wage base.2
    • A Section 125 plan makes employee benefit contributions pre-tax, removing them from FICA-taxable wages and saving both parties 7.65% on every contributed dollar.1
    • For a 35-employee company where employees contribute an average of $3,600/year to health premiums, the employer saves approximately $9,639 annually in FICA taxes alone — with zero additional cost to implement.
    • Most employers recoup setup costs within 1 to 3 months — setup costs range from $500 to $2,000, while annual savings exceed that amount within 30 to 60 days for most employers.
    • Without a properly documented Section 125 plan, the IRS considers all premium deductions as post-tax56 — meaning you may be paying FICA taxes you do not owe.

    The FICA Multiplier: How Section 125 Savings Actually Work

    At Business Insurance Health and PEO4YOU, we call this The FICA Multiplier because the savings compound across every employee, every pay period, and every benefit dollar — without changing the benefits themselves.

    Here is the math:

    Section 125 FICA Savings Calculator: 35-Employee Company

    Assumptions:

    • 35 employees enrolled in health coverage
    • Average employee premium contribution: $300/month ($3,600/year)
    • All contributions run through Section 125 pre-tax
    • FICA rate: 7.65% (employer share)2

    Calculation:

    • Total employee contributions: 35 × $3,600 = $126,000/year
    • Employer FICA savings (7.65%): $126,000 × 0.0765 = $9,639/year
    • Employee FICA savings (7.65%): $126,000 × 0.0765 = $9,639/year (distributed across all employees)
    • Per-employee FICA savings: $3,600 × 0.0765 = $275.40/year each
    • Combined employer + employee annual savings: $19,278

    Math verification:

    • 35 × $3,600 = $126,000 ✓
    • $126,000 × 0.0765 = $9,639 ✓
    • $9,639 × 2 = $19,278 ✓
    • $3,600 × 0.0765 = $275.40 ✓

    That is $9,639 in employer savings from a plan that costs $500 to $2,000 to set up. The return on investment exceeds 400% in the first year — and the savings recur every year without additional cost.

    Section 125 FICA savings breakdown showing 35 employees saving 19278 dollars annually in combined employer and employee payroll tax savings

    What Qualifies Under Section 125

    A Section 125 cafeteria plan can include pre-tax treatment for:1

    • Health plan premiums — the most common and highest-dollar component
    • Health Flexible Spending Accounts (FSA) — up to $3,400 in 2026, with $680 rollover3
    • Health Savings Accounts (HSA) — up to $4,400 individual / $8,750 family in 20264
    • Dependent Care Assistance — up to $7,500 per household in 2026 (increased from $5,000 by the One Big Beautiful Bill Act, effective January 1, 2026)
    • Dental and vision premiums
    • Short-term and long-term disability premiums (with specific tax implications on benefit payments)
    • Adoption assistance

    The broader the range of benefits run through the Section 125 plan, the greater the FICA savings for both employer and employee. Most employers start with health premiums (the largest dollar amount) and expand to include FSA, HSA, and dependent care over time.

    Why Most Small Employers Get This Wrong

    The compliance trap with Section 125 is not whether you offer pre-tax deductions — it is whether you have the proper plan document to support them. Under IRS regulations, a Section 125 plan must have:

    1. A written plan document that describes the benefits offered, eligibility rules, election procedures, and plan year
    2. Annual nondiscrimination testing to ensure the plan does not disproportionately favor highly compensated employees
    3. Proper election procedures — employees must make elections before the plan year begins (with qualifying life event exceptions)
    4. Timely distribution of Summary Plan Descriptions to all eligible employees

    Here is where it gets dangerous: if an employer takes pre-tax deductions from employee paychecks without a properly documented Section 125 plan, the IRS can reclassify those deductions as post-tax — retroactively. That means the employer owes back FICA taxes on all reclassified amounts, plus penalties and interest.

    At Business Insurance Health, we have reviewed Section 125 plans where the plan document was created in 2015 and never updated, where nondiscrimination testing was never performed, or where no written plan document existed at all. In every case, the employer was taking pre-tax deductions they were not legally entitled to take.

    Section 125 Through a PEO: The Compliance Advantage

    When a company joins a PEO through PEO4YOU, the Section 125 plan is built into the PEO’s master plan. This means:

    • The plan document is maintained and updated by the PEO — no need for the employer to hire a benefits attorney to draft or update it
    • Nondiscrimination testing is handled by the PEO as part of annual compliance
    • Election procedures are embedded in the onboarding portal — employees make their elections during enrollment, and the system enforces the IRS rules automatically
    • The PEO assumes compliance risk for proper plan administration under the co-employment arrangement

    This is particularly valuable for employers transitioning from a standalone plan where compliance may have been inconsistent. The PEO essentially “resets” the Section 125 compliance to current standards, and the Taft-Hartley multiemployer trust structure provides additional regulatory protections.

    Comparison of DIY Section 125 plan compliance costs versus PEO managed Section 125 showing zero additional cost through PEO

    Scaling the Savings: From 25 to 200 Employees

    Company Size Annual Employee Contributions Employer FICA Savings Combined Savings
    25 employees $90,000 $6,885 $13,770
    50 employees $180,000 $13,770 $27,540
    100 employees $360,000 $27,540 $55,080
    200 employees $720,000 $55,080 $110,160

    Assumes average employee contribution of $3,600/year ($300/month) and FICA rate of 7.65%. Actual savings vary based on employee contribution levels, wage distribution relative to the $184,500 Social Security wage base, and benefit elections.

    “Most employers are already paying for health benefits. Section 125 does not change what you pay — it changes how you pay, and that changes what the IRS takes. It is the simplest tax savings strategy that a significant share of small employers still do not use.”

    — BIH benefits analysis team

    For companies exploring broader benefits cost reduction strategies, see how PEO cost analysis works and how Taft-Hartley health plans combine with Section 125 to maximize tax-advantaged savings.

    📊 STRESS TEST YOUR BENEFITS STRATEGY

    Test how your benefits structure — including Section 125 FICA savings — holds up under different scenarios. Use the Business Insurance Stress Test below — no login required, no email gate, free.

    Frequently Asked Questions

    Do I need a Section 125 plan if I already offer health benefits?

    If employees contribute any portion of their health premiums through payroll deduction and you want those deductions to be pre-tax, yes — a Section 125 plan document is legally required. Without it, the IRS considers all deductions post-tax, and both you and your employees pay unnecessary FICA taxes.1

    Can a Section 125 plan be set up mid-year?

    Yes, with limitations. A short plan year can be established mid-year to begin pre-tax treatment immediately. However, employees can only change elections mid-year if they experience a qualifying life event (marriage, birth, loss of other coverage, etc.). Annual open enrollment would then align with the new plan year start date.

    Does Section 125 reduce Social Security benefits for employees?

    Technically, yes — pre-tax deductions reduce the wages reported for Social Security purposes, which could marginally reduce future Social Security benefits. However, the immediate tax savings of 7.65% on every contributed dollar typically far outweighs the marginal future benefit reduction, especially for employees under the $184,500 wage base.2

    How much does it cost to set up a Section 125 plan?

    Standalone setup through a benefits attorney or third-party administrator typically costs $500 to $2,000, with annual compliance and testing costs of $500 to $1,000. Through a PEO, the Section 125 plan is included in the PEO’s administration at no additional cost.

    What happens if my Section 125 plan fails nondiscrimination testing?

    If the plan disproportionately benefits highly compensated employees, the excess benefits for those employees become taxable. The plan itself is not disqualified, but the HCEs lose their pre-tax treatment. This is why annual testing is critical — it identifies and corrects imbalances before they create tax liability.

    📊 BENCHMARK YOUR BENEFITS STRUCTURE

    Plan Quality & HRA Analyzer at businessinsurance.health

    See how your current plan design — including tax optimization through Section 125 — compares to institutional benchmarks from the KFF Employer Health Benefits Survey.

    No login required. No email gate. Free.

    References

    1. Internal Revenue Service. “FAQs for Government Entities Regarding Cafeteria Plans.” irs.gov. “A section 125 plan is the only means by which an employer can offer employees a choice between taxable and nontaxable benefits.”
    2. Internal Revenue Service. “Topic No. 751, Social Security and Medicare Withholding Rates.” irs.gov. Social Security: 6.2% employer + 6.2% employee; Medicare: 1.45% + 1.45%. SS wage base 2026: $184,500.
    3. Internal Revenue Service. “Revenue Procedure 2025-32: 2026 FSA Contribution Limits.” irs.gov. Health FSA: $3,400; Rollover: $680.
    4. Internal Revenue Service. “Revenue Procedure 2025-19: HSA Contribution Limits for 2026.” irs.gov. Self-only: $4,400; Family: $8,750.
    5. Investopedia. “Section 125 Plan (Cafeteria Plan): How Does It Work?” October 2025. investopedia.com.
    6. ADP. “Section 125 Cafeteria Plan.” October 2025. adp.com. “These deductions not only decrease the employee’s taxable income, but also reduce the employer’s payroll tax liabilities.”

    This article is for educational purposes and does not constitute tax or legal advice. Section 125 plan design and compliance requirements are complex. Consult your tax advisor or benefits attorney for guidance specific to your company.


    About the Author

    Sam Newland, CFP® is the Founder and President of Business Insurance Health and PEO4YOU. Contact: [email protected] | 857-255-9394

  • Leaving ADP for a PEO? Here’s What the Transition Actually Looks Like

    Leaving ADP for a PEO? Here’s What the Transition Actually Looks Like

    Your company just decided to leave ADP. Maybe it was ADP Run, maybe ADP TotalSource. Either way, the decision is made, the start date is set, and now your employees are wondering: what does this actually mean for me?

    Having guided dozens of companies through exactly this transition at PEO4YOU, I can tell you that the anxiety employees feel is almost always worse than the reality. The onboarding takes about 20 minutes. The benefits are typically better. And the support system on the other side — a dedicated HR partner, a dedicated benefits specialist, a dedicated payroll specialist — is something most employees have never experienced before.

    Here is exactly what happens, step by step.

    Key Takeaways

    • The transition from ADP to a PEO takes 30 to 60 days from decision to go-live, with employee onboarding taking approximately 20 minutes per person.
    • Benefits typically improve significantly: companies switching from ADP Run gain access to PEO-pooled health plans with lower deductibles, richer coverage, and employer-subsidized premiums that individual small group plans cannot match.
    • Each employee gets a dedicated team: an HR business partner, a benefits specialist, and a payroll specialist — accessible by direct phone line and email.
    • HSA accounts require a new provider if coming from ADP’s HSA platform, but existing balances can be transferred.
    • Current benefits terminate on the last day of the current plan and PEO benefits begin the following day, ensuring no gap in coverage.

    The PEO Transition Playbook: From Decision to Day One

    We call this The PEO Transition Playbook because the process follows the same predictable sequence every time. Companies that understand each phase in advance experience less disruption and higher employee satisfaction.

    Phase 1: Decision and Setup (Days 1–14)

    Once the decision to switch is made, the PEO begins building the employer’s profile. This includes:

    • Collecting current census data (employee names, dates of birth, addresses, compensation)
    • Establishing the co-employment relationship and legal documentation
    • Configuring payroll schedules, tax jurisdictions, and deduction structures
    • Setting up the benefits package options the employer selected during the evaluation

    For the employer, this phase requires about four to six hours of administrative time total. The PEO handles the heavy lifting.

    Phase 2: Employee Communication (Days 14–21)

    This is the phase most companies underestimate. How you communicate the transition to employees determines whether they see it as an upgrade or a disruption.

    Best practice: schedule a company-wide benefits orientation call with the PEO team. This is where employees meet their dedicated HR partner, benefits specialist, and payroll specialist by name. They hear directly from the people who will support them going forward.


    PEO transition timeline showing four phases from decision to go-live over 30 days

    Phase 3: Employee Onboarding (Days 21–30)

    Each employee receives an email with a registration link. The onboarding process includes:

    1. Create username and password — this becomes the permanent login for the employee self-service portal
    2. Complete new hire paperwork — because the PEO establishes a co-employment relationship, employees onboard as if joining a new employer (I-9 verification, tax forms, direct deposit)
    3. Elect benefits — once onboarding paperwork is complete and I-9 is verified, employees receive access to the benefits enrollment portal

    The system is step-by-step with a checklist that shows green checkmarks as each section is completed. Total time: approximately 20 minutes.

    “The system is very intuitive, very helpful, step-by-step, pretty easy to use. I’ve already done it. If you have any questions, ask them, but they’re also very accessible as well.”

    — Business owner describing the PEO onboarding experience to his team during a recent transition from ADP

    Phase 4: Go-Live and Beyond

    On the effective date, payroll processes through the PEO, benefits are active, and the employee self-service portal provides access to:

    • Pay stubs and deduction details
    • Personal information updates (address changes, emergency contacts)
    • Direct deposit changes
    • Benefits enrollment modifications (during qualifying life events)
    • Tax document access (W-2s)

    What the Benefits Actually Look Like After Switching

    This is where the transition from ADP becomes tangible for employees. Most companies leaving ADP Run are moving from whatever fully insured small group plan their broker placed them on. When they enter a PEO’s pooled benefits program, the plan design typically improves dramatically.

    A typical PEO benefits package through PEO4YOU includes two medical plan options:


    Benefits comparison table showing ADP Run small group plan versus PEO pooled benefits across deductibles copays and coverage

    Option 1: Copayment Plan (No Deductible)

    Benefit Coverage
    Deductible $0 (no deductible)
    Primary Care Copay $25
    Specialist Copay $50
    ER Copay $750 + 20% coinsurance
    Hospital Inpatient $1,000 copay + 20% coinsurance
    OOP Max (Individual/Family) $5,000 / $10,000
    Urgent Care $50 copay
    Preventive Care 100% covered
    Network National PPO (Open Access Plus)

    Option 2: High Deductible Health Plan (HDHP) with HSA

    Benefit Coverage
    Deductible (Individual/Family) $3,500 / $7,000
    After Deductible 100% covered (all services including Rx)
    OOP Max (Individual/Family) $3,500 / $7,000 (same as deductible)
    Preventive Care 100% covered (no deductible)
    HSA Eligible Yes — $4,400 individual / $8,750 family (2026 IRS limits)
    HSA Catch-Up (55+) Additional $1,000
    Network National PPO (Open Access Plus)

    Note: The HDHP option is notable because once you meet the deductible, everything — including prescriptions — is covered at 100%. The OOP max equals the deductible, meaning there is no gap between deductible and maximum exposure. For a 35-year-old individual, the worst-case annual cost is $3,500.

    Dental Coverage: Three Tiers

    Most PEO dental plans offer significantly higher annual maximums than typical small group plans:

    • Core Plan: $1,000 annual max, 60% basic / 50% major, employer-paid at 100%
    • High Plan: $2,000 annual max, 80% basic / 50% major
    • Buy-Up Plan: $5,000 annual max, 80% basic / 80% periodontics / 50% implants

    For comparison, the average small group dental plan offers a $1,000 annual maximum.15 The PEO buy-up plan at $5,000 is five times that — enough to cover an implant procedure in a single plan year.

    Vision, Life, and Voluntary Benefits

    • Vision: Covered at 100% (no employee cost). $10 exam copay, $175 frame allowance, frames and contacts both covered every 12 months
    • Basic Life: $10,000 employer-paid at no cost
    • Voluntary Life: Up to $250,000 guaranteed issue (no medical underwriting required), spouse up to $25,000 guaranteed issue
    • Whole Life: Up to $100,000 guaranteed issue, fixed premiums, cash value accumulation
    • FSA: Up to $3,400 pre-tax (2026 limit)3, front-loaded, $680 rollover
    • Dependent Care FSA: Up to $7,500 per household

    Many PEO health plans are structured as Taft-Hartley multiemployer trusts, which is how they achieve renewal rates typically in the 2-5% range — compared to 8-12% in the small group fully insured market. The pooled risk structure means one bad claims year does not devastate your renewal.

    The guaranteed-issue life coverage is particularly valuable. An employee who smokes, has a pre-existing condition, or has been declined for individual life coverage can purchase up to $250,000 through the PEO with no medical underwriting — simply because they are enrolling during the initial eligibility window.

    The HSA Transfer Question

    If your company used ADP’s HSA platform, employees cannot continue contributing to that same account through the new PEO. They will need to open a new HSA with the PEO’s banking partner. However:

    • Existing HSA balances remain accessible — the money belongs to the employee
    • Funds can be transferred from the ADP HSA to the new HSA
    • If employees have personal HSAs (not through ADP), those can often be linked directly
    • 2026 contribution limits: $4,400 individual / $8,750 family — any amounts already contributed in 2026 count toward the annual limit2

    What Your Employees Will Notice Immediately

    Based on dozens of transitions we have managed at PEO4YOU, here is what employees consistently report in the first 30 days:

    1. “I can actually call someone.” The dedicated benefits specialist answers by name. This is not a call center. For companies evaluating the difference, see our analysis of PEO health benefits models.
    2. “My copay is lower.” Going from a $6,800 deductible where everything requires meeting the deductible first, to a $25 PCP copay with no deductible, changes how employees use their coverage.
    3. “Claims disputes get resolved.” The PEO’s benefits team can intervene directly with carriers on claims disputes — something that essentially does not exist in the traditional fully insured market. This service alone saves employees 8 to 20 hours per disputed claim.
    4. “The dental max is $5,000?” For employees who have been on $1,000-max dental plans for years, the buy-up option is transformative.

    For a deeper look at the cost comparison, see our analysis of high deductible health plan alternatives that shows how PEO-pooled plans deliver $1,000 deductibles at lower total cost.


    Four key PEO benefits employees notice immediately including low copays dedicated support guaranteed issue life and high dental maximums

    📊 BUILD YOUR BENEFITS SAVINGS STRATEGY

    Model the savings from switching to PEO-pooled benefits. Use the Benefits Savings Strategy Builder below — no login required, no email gate, free.

    Frequently Asked Questions

    How long does the transition from ADP to a PEO take?

    Typically 30 to 60 days from decision to go-live. Most transitions complete in 30 days; the 60-day timeline applies when complex payroll migrations, multi-state tax setups, or custom benefit configurations are involved. The employer setup takes 1-2 weeks, employee communication and orientation happens in week 3, and employee onboarding occurs in weeks 3-4. Benefits are active on the first day of the new plan month.

    Will my employees lose coverage during the transition?

    No. Current benefits terminate on the last day of the existing plan period, and PEO benefits begin the following day. There is no gap in coverage. Employees who have met deductible on their prior plan can submit for deductible credit on the new plan.

    Can employees keep their current doctors?

    Most PEO health plans use broad national PPO networks. In the scenario described here, the Open Access Plus network is one of the largest in the country. Employees should verify their specific providers are in-network before the transition completes.

    What happens to existing 401(k) accounts with ADP?

    Existing 401(k) balances remain with the current plan until a rollover is initiated. The PEO may offer its own 401(k) plan, and employees can roll over prior balances. This is a separate process from the benefits and payroll transition.

    Is ADP TotalSource different from ADP Run for transition purposes?

    Yes. ADP TotalSource is ADP’s PEO product, which means employees are already in a co-employment arrangement. Transitioning from TotalSource involves unwinding that relationship. ADP Run is a payroll-only product, making the transition to a full PEO simpler because there is no existing co-employment to dissolve. HSA handling may differ between the two.

    📊 BENCHMARK YOUR BENEFITS DESIGN

    Plan Quality & HRA Analyzer at businessinsurance.health

    See how your current ADP plan design (deductible, copays, OOP max, network) compares to PEO-pooled alternatives. Benchmark against institutional data from the KFF Employer Health Benefits Survey.

    No login required. No email gate. Free.

    Like this tool? We built five more just like it — all free, all ungated. Explore all tools at Business Insurance Health.

    References

    1. National Association of Dental Plans (NADP). “2024 State of the Dental Benefits Market.” nadp.org. Average small group dental annual maximum: $1,000–$1,500.
    2. Internal Revenue Service. “Revenue Procedure 2025-19: HSA Contribution Limits for 2026.” irs.gov. Self-only: $4,400; Family: $8,750; Catch-up (55+): $1,000.
    3. Internal Revenue Service. “Revenue Procedure 2025-32: 2026 FSA Contribution Limits.” irs.gov. Health FSA: $3,400; Rollover: $680. Dependent Care FSA $7,500 per the One Big Beautiful Bill Act (amending IRC Section 129), effective January 1, 2026.
    4. Kaiser Family Foundation. “2025 Employer Health Benefits Survey.” October 2025. kff.org. Average deductible for firms with 10-199 workers: $2,631.
    5. National Association of Professional Employer Organizations (NAPEO). “PEO Industry Research & Data.” 2025. napeo.org.
    6. Aon plc. “U.S. Employer Health Care Costs Expected to Rise 9.5 Percent in 2026.” September 2025. aon.mediaroom.com.

    This article is for educational purposes and does not constitute financial or legal advice. Benefits packages vary by PEO and plan selection. Actual costs and coverage depend on employer size, demographics, and plan election. Consult your benefits advisor for guidance specific to your situation.


    About the Author

    Sam Newland, CFP® is the Founder and President of Business Insurance Health and PEO4YOU. With 13+ years in the employee benefits industry, Sam has guided dozens of companies through ADP-to-PEO transitions. Contact: [email protected] | 857-255-9394

  • Your Employees Can’t Actually Use a $6,800 Deductible Plan — Here’s How to Get Them a $1,000 Deductible for Less

    Your Employees Can’t Actually Use a $6,800 Deductible Plan — Here’s How to Get Them a $1,000 Deductible for Less

    Your benefits broker just presented this year’s renewal options. The “most affordable” plan has a $6,800 deductible. The one with a $2,000 deductible costs 30% more. And the plan your employees actually want — low copays, reasonable deductible, broad network — does not seem to exist in your price range.

    Here is what your broker probably did not tell you: there is a category of high deductible health plan alternatives that delivers a $1,000 deductible, $3,800 out-of-pocket maximum, first-dollar copays, and Blue Cross Blue Shield PPO access — often at a lower total cost than the $6,800 deductible plan you are being quoted.

    The reason your broker did not mention it? These plans exist outside the traditional fully insured market.

    Key Takeaways

    • The average deductible for workers at small firms (10-199 employees) reached $2,631 in 2025 — but many employers face $5,000 to $6,800 deductibles on their “affordable” plan options.1
    • High deductible plans create a paradox: employees avoid using coverage they technically have, leading to worse health outcomes and higher downstream costs.
    • Multiemployer trust plans (Taft-Hartley) offer $1,000 deductibles with $3,800 out-of-pocket maximums at premiums competitive with — or lower than — high-deductible fully insured plans.
    • The six-year cost projection shows that a trust plan with under 3% annual renewals saves $180,000 to $350,000 more than a fully insured plan with 7% to 9% renewals for a 35-employee company.
    • Employer contribution strategy matters: covering 95% of the individual employee premium makes the plan cost roughly $47 per month per employee — competitive with marketplace plans but with dramatically better coverage.

    The Deductible Trap: Why “Affordable” Plans Are Anything But

    When we analyze health plan renewals at Business Insurance Health and PEO4YOU, we see a pattern we call The Deductible Trap. It works like this:

    1. Employer receives a renewal with a 12% to 19% premium increase.
    2. Broker presents “options” — all of which involve increasing the deductible to offset the premium increase.
    3. Over three to five years, the deductible creeps from $1,500 to $3,000 to $5,000 to $6,800.
    4. Employees now have “coverage” they cannot afford to use. A $6,800 deductible means the average employee pays the full cost of most medical care out of pocket.1
    5. Employees defer care, leading to more expensive emergency visits and chronic condition progression.
    6. The employer pays the same or more in premiums each year, while employees receive progressively less value.

    Aon projects employer health care costs will exceed $17,000 per employee in 2026, a 9.5% increase.2 For employers trapped in the fully insured renewal cycle, that cost increase comes with worse plan design, not better.


    Cost comparison table showing fully insured high deductible plan versus multiemployer trust plan benefits and costs

    What a $1,000 Deductible Plan Actually Looks Like

    Consider a scenario we encounter regularly: a company with 30 to 40 employees is evaluating its renewal options. The fully insured quotes come back with $6,800 deductibles and limited network options. Then we model the same company on a multiemployer trust plan through PEO4YOU.

    The comparison:

    Plan Feature Fully Insured Quote Multiemployer Trust Plan
    Deductible $6,800 $1,000
    Out-of-Pocket Maximum $6,800 $3,800
    Coinsurance Varies by plan 20%
    PCP Copay Deductible applies first First-dollar copay
    Specialist Copay Deductible applies first First-dollar copay
    ER Copay Deductible applies first First-dollar copay
    Network Limited carrier network BCBS PPO
    Telehealth Not included Free (Teladoc)
    Dental Maximum $1,000/year $2,000/year
    Employee Cost (individual) $300–$500/month ~$47/month (at 95% employer contribution)

    BIH model based on actual plan comparisons for companies with 30-40 employees. Fully insured quotes reflect typical small group market offerings. Trust plan reflects Taft-Hartley multiemployer structure. Employee cost assumes 95% employer contribution to individual premium.

    The employee paying $47 per month for a $1,000 deductible BCBS PPO plan is getting dramatically more value than the employee paying $400 per month for a $6,800 deductible plan with limited network access. And the employer’s total cost is often lower because the trust plan’s pooled risk structure produces more favorable rates than the small group market.

    The Six-Year Cost Projection: Where the Real Savings Appear


    Six-year renewal projection comparing fully insured plan at 7-9% annual increases versus multiemployer trust plan at under 3% increases

    The plan comparison table tells the story at a point in time. The six-year projection tells the story that matters for your business.

    Hidden Math: Six-Year Cost Projection for a 35-Employee Company

    Model employer: Professional services company, 35 employees, average age 38, current annual premium $350,000

    Year Fully Insured (8% renewal) Trust Plan (2.5% renewal) Annual Difference
    Year 1 $350,000 $330,000 $20,000
    Year 2 $378,000 $338,250 $39,750
    Year 3 $408,240 $346,706 $61,534
    Year 4 $440,899 $355,374 $85,525
    Year 5 $476,171 $364,258 $111,913
    Year 6 $514,264 $373,365 $140,900
    6-Year Total $2,567,574 $2,107,953 $459,621

    BIH model estimate. Fully insured assumes 8% compound annual renewal (conservative within the 7-9% range for mid-size employers). Trust plan assumes 2.5% compound annual renewal. Starting premiums reflect the trust plan’s lower base rate due to pooled purchasing power. Actual savings range: $180,000 to $550,000+ depending on renewal rates and starting premium differential.

    Math verification:

    • Year 2 fully insured: $350,000 × 1.08 = $378,000 ✓
    • Year 6 fully insured: $350,000 × 1.08⁵ = $514,264 ✓
    • Year 2 trust: $330,000 × 1.025 = $338,250 ✓
    • Year 6 trust: $330,000 × 1.025⁵ = $373,365 ✓
    • 6-year totals: Sum of all years ✓

    The compounding effect is the key insight. In year one, the difference is $20,000 — meaningful but not transformational. By year six, the annual difference exceeds $140,000. The cumulative six-year savings of $459,621 funds an entire additional department, a facility upgrade, or simply stays on the balance sheet as retained earnings.

    And the trust plan employees have a $1,000 deductible the entire time, while the fully insured employees watch their deductible climb toward $8,000 or $9,000.

    Why Your Broker Is Not Showing You These Options

    Traditional benefits brokers operate within the fully insured market. Their carrier relationships, their quoting systems, and their commission structures are all built around that market. Taft-Hartley multiemployer plans, PEO arrangements, and other alternative funding strategies exist outside that ecosystem.

    This is not a criticism of brokers — it is a structural observation. A broker who only has access to fully insured carriers can only show you fully insured options. The PEO health benefits model and Taft-Hartley trust structures require specialized knowledge and carrier relationships that most traditional brokers do not maintain.

    That is exactly what Business Insurance Health and PEO4YOU were built to address. We do not replace your broker — we show you the options your broker cannot access.


    Employer contribution strategy showing 95% employer and 5% employee split on multiemployer trust plan premium

    How the Employer Contribution Strategy Makes It Work

    The contribution strategy is as important as the plan selection. Here is how a 95% employer contribution to the individual employee premium changes the math:

    • If the individual monthly premium is $940 (typical for a BCBS PPO through a multiemployer trust)
    • Employer pays 95%: $893 per month per employee
    • Employee pays 5%: approximately $47 per month

    At $47 per month, the employee contribution is lower than most ACA Marketplace silver plans — but the coverage is dramatically superior ($1,000 deductible and $3,800 OOP max versus $2,789 average Marketplace deductible).3

    This creates a powerful retention tool. An employee would need a significant salary increase at a competitor to offset the value of a $47 per month plan with first-dollar copays and BCBS PPO access. The benefits become a retention moat.

    For more on structuring contributions effectively, see what 100% employee-paid benefits really means and how small business health benefits cost breaks down across different funding strategies.

    📊 MODEL YOUR OWN SIX-YEAR PROJECTION

    Premium Renewal Stress Test at businessinsurance.health

    See how your benefits costs project across 6 years under 5 different funding strategies — including Taft-Hartley trust, PEO, level-funded, and captive options.

    No login required. No email gate. Free.

    Like this tool? We built five more just like it — all free, all ungated. Explore all tools at Business Insurance Health.

    The 50-Employee Threshold: When This Becomes Critical

    Companies approaching 50 employees face a unique inflection point. Under the ACA, companies with 50 or more full-time equivalent employees must offer health coverage or face penalties. This mandate pushes employers into the fully insured market at the exact moment when their renewal leverage is weakest.

    The irony: crossing the 50-employee threshold triggers a requirement to offer coverage, but the coverage available in the small-to-midsize fully insured market has deductibles that make the coverage nearly unusable for employees earning $40,000 to $60,000 per year.

    A Taft-Hartley multiemployer plan solves both problems simultaneously: it satisfies the ACA mandate with a plan that employees will actually use, at a cost that does not require annual deductible increases to manage renewals.

    For companies exploring the ERISA compliance implications of their benefits structure, see our analysis of the new wave of ERISA voluntary benefits lawsuits targeting employers who fail to benchmark their benefits costs.

    Frequently Asked Questions

    How can a $1,000 deductible plan cost less than a $6,800 deductible plan?

    The pricing difference comes from the risk pool, not the plan design. Fully insured small group plans are priced based on your company’s demographics and a small risk pool. Multiemployer trust plans pool hundreds or thousands of employees across multiple employers, spreading risk and achieving rates comparable to Fortune 500 companies. The larger pool supports better plan design at lower per-employee cost.

    Is a Taft-Hartley multiemployer trust plan legal for non-union companies?

    Taft-Hartley plans require a collectively bargained trust structure, which involves a collective bargaining agreement. However, the process is straightforward for companies working with an experienced benefits advisor. PEO4YOU guides employers through the legal setup, which typically takes 30 to 60 days. The trust structure has been validated by decades of ERISA case law and DOL guidance.

    What happens if our company has a high-cost claimant on the trust plan?

    This is one of the primary advantages of a multiemployer trust. A single high-cost claimant in a 35-person fully insured plan can trigger a 25% to 40% renewal increase. In a trust plan with thousands of pooled members, the same claimant has minimal impact on the overall risk pool. The trust absorbs the volatility that would devastate a small group plan. For more on this dynamic, see PEO health benefits for small businesses.

    Can we keep our current doctors and hospitals with a trust plan?

    Most trust plans offer BCBS PPO networks, which are among the broadest in the country. In most markets, employees retain access to the same providers they currently use. The network comparison should be part of your evaluation — ask for the specific network and verify provider access before making a decision.

    What is the minimum company size for a multiemployer trust plan?

    Most trusts require a minimum of 5 benefits-eligible employees. This makes them accessible to companies well below the 50-employee ACA mandate threshold. Companies with 20 to 50 employees often see the most dramatic improvement in plan quality and cost when transitioning from fully insured to a trust structure.

    📊 COMPARE YOUR PLAN QUALITY

    Plan Quality & HRA Analyzer at businessinsurance.health

    Benchmark your current plan design (deductible, OOP max, copays, network) against institutional data and see how your coverage compares to what is available through alternative funding strategies.

    No login required. No email gate. Free.

    Like this tool? We built five more just like it — all free, all ungated. Explore all tools at Business Insurance Health.

    References

    1. Kaiser Family Foundation. “2025 Employer Health Benefits Survey.” October 2025. kff.org. Average single premium $9,325; average deductible for firms with 10-199 workers: $2,631; overall average deductible: $1,886.
    2. Aon plc. “U.S. Employer Health Care Costs Expected to Rise 9.5 Percent in 2026.” September 2025. aon.mediaroom.com. Projected costs exceeding $17,000 per employee.
    3. Peterson-KFF Health System Tracker. “How ACA Marketplace Costs Compare to Employer-Sponsored Coverage.” November 2025. healthsystemtracker.org. Average ACA individual market deductible: $2,789.
    4. National Association of Professional Employer Organizations (NAPEO). “PEO Industry Research & Data.” 2025. napeo.org. PEO users report double median revenue growth and 27.2% average ROI.
    5. Business.com. “Healthcare Employer and Employee Costs in 2026.” January 2026. business.com. Aon projection: average employer health cost exceeding $17,000/employee in 2026.
    6. Bureau of Labor Statistics. “Employer Costs for Employee Compensation — September 2025.” bls.gov. Benefits account for 29.7% of total compensation.

    This analysis is provided for educational purposes and does not constitute financial or legal advice. Plan comparisons are BIH model estimates based on typical market conditions for mid-size employers. Actual costs vary by geography, employee demographics, and claims history. All projections are presented as ranges. Consult your benefits advisor for guidance specific to your situation.


    About the Author

    Sam Newland, CFP® is the Founder and President of Business Insurance Health and PEO4YOU. With 13+ years in the employee benefits industry and experience as the #1 face-to-face health benefits agent nationally, Sam built BIH on a transparency-first philosophy: “What Most Brokers Can’t — or Won’t — Show You.” Contact: [email protected] | 857-255-9394

  • Your Broker’s Commission Could Get You Sued — Here’s What Employers Need to Know About the New ERISA Lawsuits   

    Your Broker’s Commission Could Get You Sued — Here’s What Employers Need to Know About the New ERISA Lawsuits   

    Your benefits broker just renewed your voluntary benefits package. Disability, life, accident, critical illness — the usual lineup. Your employees signed up, the premiums come out of their paychecks, and you assumed that was the end of your responsibility.

    It is not. A new wave of ERISA class action lawsuits is targeting employers — including United Airlines, Allied Universal, and Laboratory Corporation of America — for exactly this scenario. The allegation: employers breached their fiduciary duty by allowing brokers to charge excessive commissions on voluntary benefit programs, and the employees paid the price through inflated premiums.1

    If your company has 100 or more employees and offers voluntary benefits, this is a risk you need to understand right now.

    Key Takeaways

    • A new wave of ERISA class action lawsuits (filed late 2025 through early 2026) targets employers over excessive broker commissions on voluntary benefits — even when employees pay 100% of the premium.1
    • The lawsuits allege fiduciary breach under ERISA Section 404 — employers have a duty to ensure broker fees are reasonable, carriers are competitively selected, and loss ratios are monitored.2
    • Employers with 100+ employees are the primary targets because their plans are large enough to attract class action attorneys and generate meaningful damages.
    • The fix is procedural, not expensive — documenting your broker selection process, requiring fee disclosure, and benchmarking premiums against market rates creates a defensible record.
    • Taft-Hartley multiemployer plans and PEO arrangements can shift fiduciary responsibility off the employer, reducing exposure.

    What Are the ERISA Voluntary Benefits Lawsuits About?

    The law firm Schlichter Bogard — the same firm behind landmark 401(k) excessive fee litigation — launched this new genre of ERISA lawsuits in late 2025.3 The core theory is straightforward:

    1. Employers integrate voluntary benefits (disability, life, accident, critical illness) into their ERISA welfare plans.
    2. Brokers and consultants recommend specific carriers and negotiate commissions — often 15% to 30% of premiums — that are not disclosed to employees.1
    3. Employers fail to benchmark these commissions against market rates or evaluate whether lower-cost alternatives exist.
    4. Employees pay inflated premiums through payroll deduction, never knowing that a significant portion funds broker compensation rather than actual coverage.

    The lawsuits name both the employer (as plan fiduciary) and the broker or consultant (as a “functional fiduciary” who exercises discretion over plan administration).2

    What makes this litigation particularly dangerous: the fact that employees pay 100% of the premium does not reduce the employer’s fiduciary obligation. Under ERISA, if you sponsor the plan and exercise discretion over provider selection, you have a duty to ensure fees are reasonable — regardless of who pays them.2


    The Voluntary Benefits Markup Problem showing how undisclosed broker commissions inflate employee premiums and create ERISA liability

    The Voluntary Benefits Markup Problem: Why Employers Are Exposed

    When we analyze voluntary benefits programs at Business Insurance Health and PEO4YOU, we consistently find what we call The Voluntary Benefits Markup Problem. Here is how it works:

    A broker recommends a voluntary benefits package from a specific carrier. The premiums seem reasonable on the surface. But hidden inside those premiums is a commission structure that may include:

    • First-year commissions of 15% to 30% of premium — significantly higher than commissions on medical coverage1
    • Renewal commissions of 5% to 15% that continue indefinitely
    • Override bonuses based on total premium volume placed with a carrier
    • No competitive bidding — the broker recommends one carrier without comparing three or more options

    The result: employees pay $100 per month for voluntary disability coverage, but only $70 to $85 of that goes toward actual coverage. The rest is broker compensation that was never disclosed and never benchmarked against market rates.

    According to Holland & Knight’s analysis of these cases, plaintiffs allege that brokers “exercise discretion in administering voluntary benefit plans by withholding information about lower-cost options to maximize commissions.”2 That is the core of ERISA voluntary benefits compliance risk.

    Who Is Being Sued — And Who Could Be Next

    The initial wave of lawsuits (filed December 2025 through February 2026) targets some of the largest employers in the country:13

    Employer Broker/Consultant Named Core Allegation
    United Airlines Mercer Excessive commissions, failure to monitor loss ratios
    Allied Universal Named broker Failure to benchmark carrier selection and fees
    Laboratory Corp. of America Named broker Self-dealing, excessive premiums

    The pattern is clear: large employers with large voluntary benefits enrollment generate the highest potential damages. But if you have 100 or more employees and offer voluntary benefits through a broker who has not disclosed their commission structure, you carry the same structural risk — just at a smaller scale.

    With employer health care costs projected to rise 9.5% in 2026, exceeding $17,000 per employee according to Aon,4 the pressure to contain all benefits costs — including voluntary programs — is intensifying. And where there is financial pressure, class action attorneys see opportunity.

    How to Protect Your Company: The ERISA Compliance Checklist


    ERISA compliance checklist for employers to protect against voluntary benefits lawsuits

    The good news: protecting your company is procedural, not expensive. The lawsuits target employers who did nothing — no benchmarking, no fee disclosure, no documentation. Creating a defensible process costs far less than defending a class action.

    Here is what we recommend at Business Insurance Health based on our analysis of these cases:

    1. Require Full Commission Disclosure from Your Broker

    Ask your broker — in writing — to disclose all compensation they receive from every voluntary benefits carrier they recommend. This includes first-year commissions, renewal commissions, overrides, bonuses, and any indirect compensation. If they refuse, that tells you something.

    2. Benchmark Voluntary Benefits Premiums Annually

    Compare your voluntary benefits premiums against at least three alternative carriers every year. Document the comparison. Even if you stay with the current carrier, the record shows you exercised fiduciary diligence.

    3. Document Your Carrier Selection Process

    Create a written record of why you selected each voluntary benefits carrier. Note the factors considered: premium cost, coverage quality, claims payment record, commission levels, and service quality. This documentation is your primary defense if challenged.

    4. Review Loss Ratios

    Request loss ratio data from your voluntary benefits carriers. If a carrier is paying out less than 60% of collected premiums in claims, that is a signal that the premiums may be excessive — and that broker commissions or carrier margins are absorbing the difference.

    5. Consider a PEO or Taft-Hartley Structure

    One of the most effective ways to reduce ERISA fiduciary exposure is to shift the plan sponsorship to a Professional Employer Organization or a Taft-Hartley multiemployer trust. Under a PEO arrangement, the PEO becomes the plan sponsor and assumes the fiduciary responsibility for benefits selection and administration. Under a Taft-Hartley trust, the trust’s board of trustees (jointly managed by employer and employee representatives) holds fiduciary responsibility.

    This is a strategy that PEO4YOU implements specifically for companies concerned about fiduciary exposure. The multiemployer trust structure has an additional advantage: renewal increases consistently under 3%, compared to 7% to 9% for small group fully insured plans.5 You reduce legal risk and cost simultaneously.

    6. Audit Your Plan Documents

    Ensure your ERISA plan documents accurately describe the voluntary benefits offered, the process for carrier selection, and the fee structure. Outdated or vague plan documents create ambiguity that plaintiffs exploit.

    “The employers being sued did not overpay for benefits. They underpaid for documentation. A $2,000 annual benchmarking process would have prevented a $20 million class action.”

    — BIH analysis of ERISA voluntary benefits litigation patterns

    📊 BENCHMARK YOUR BENEFITS COSTS

    Premium Renewal Stress Test at businessinsurance.health

    Model your benefits costs across 6 years under 5 funding strategies — including PEO and Taft-Hartley options that reduce fiduciary exposure.

    No login required. No email gate. Free.

    Like this tool? We built five more just like it — all free, all ungated. Explore all tools at Business Insurance Health.

    Why This Matters Even If You Have Fewer Than 100 Employees

    The current lawsuits target companies with thousands of employees because the damages are larger. But ERISA’s fiduciary standards apply to every employer who sponsors an ERISA-covered welfare plan — regardless of size.

    The average deductible for workers at firms with 10 to 199 employees is $2,631, compared to $1,670 at larger firms.5 Smaller employers are already asking employees to absorb more cost. If those employees discover that their voluntary benefits premiums also include undisclosed broker markups, the sense of unfairness compounds — and so does the litigation risk as class action firms expand their target list.

    For employers exploring alternatives to high-deductible fully insured plans, understanding what 100% employee-paid benefits really means is the first step toward a more transparent structure. And for companies evaluating whether a PEO health benefits model could reduce both costs and fiduciary risk, the comparison is worth running.


    How PEO and Taft-Hartley trust structures shield employers from ERISA fiduciary liability on voluntary benefits

    The Connection to Your Overall Benefits Strategy

    ERISA voluntary benefits compliance does not exist in a vacuum. It connects directly to how you fund and administer your entire benefits program.

    Companies that use a transparent, benchmarked approach to their core health benefits — through a PEO, Taft-Hartley trust, or properly structured self-funded plan — tend to apply the same rigor to voluntary benefits. The documentation habits transfer. The fiduciary mindset transfers.

    Companies that hand everything to a single broker and never ask questions are the ones getting sued. Not because the broker was necessarily dishonest, but because the employer never verified. Under ERISA, the duty to investigate is non-delegable.2

    For companies navigating these decisions alongside startup growth, see our framework for when to start offering startup employee benefits. And for logistics firms facing similar compliance challenges alongside driver retention pressures, see logistics company employee benefits strategies.

    Frequently Asked Questions

    Can an employer be liable under ERISA for voluntary benefits that employees pay for entirely?

    Yes. Under ERISA Section 404, if you sponsor the plan and exercise discretion over provider selection, you have a fiduciary duty to ensure fees are reasonable — regardless of who pays the premiums. The new wave of lawsuits specifically targets this scenario, alleging that employers failed to benchmark broker commissions even though employees bore the full cost.1

    What commission level on voluntary benefits is considered “excessive” under ERISA?

    There is no specific percentage threshold. The standard is reasonableness in context — have you compared the fees to market rates? Have you documented the comparison? Commissions of 15% to 30% on voluntary benefits are common, but without benchmarking documentation, any commission level could be challenged as excessive. The process matters more than the number.

    Does using a PEO eliminate ERISA fiduciary liability for voluntary benefits?

    It significantly reduces it. In a PEO co-employment arrangement, the PEO typically becomes the plan sponsor and assumes fiduciary responsibility for benefits selection and administration. However, the employer should confirm in writing that the PEO agreement explicitly transfers fiduciary duties. PEO4YOU structures these arrangements specifically to address fiduciary risk.

    How often should employers benchmark their voluntary benefits programs?

    At minimum annually, and whenever a broker recommends a new carrier or a significant premium increase. The benchmarking should include at least three carrier alternatives and document the factors considered in the selection decision. This creates the defensible record that the current lawsuits target employers for lacking.

    Are these ERISA lawsuits likely to expand to smaller employers?

    The current wave targets companies with 1,000+ employees because the damages justify class action economics. However, the legal theory applies equally to any employer sponsoring an ERISA plan with voluntary benefits. As the litigation framework matures and early cases produce settlements, class action firms are expected to lower their size threshold. Employers with 100+ employees should act now; employers with 50+ should be aware.

    📊 SEE HOW YOUR BENEFITS STRUCTURE COMPARES

    Plan Quality & HRA Analyzer at businessinsurance.health

    Benchmark your plan design against market standards — including deductible levels, out-of-pocket maximums, and cost-sharing structures that affect both employee satisfaction and fiduciary compliance.

    No login required. No email gate. Free.

    Like this tool? We built five more just like it — all free, all ungated. Explore all tools at Business Insurance Health.

    References

    1. Frier Levitt, LLC. “Self-Funded Employee Health Benefit Plans and Consultants/Brokers Face String of ERISA Fiduciary Breach Lawsuits for Mismanagement of Voluntary Benefit Programs.” February 2026. frierlevitt.com.
    2. Holland & Knight LLP. “Understanding the New Wave of ERISA Litigation Targeting Voluntary Benefit Plans.” January 2026. hklaw.com.
    3. NAPA-Net (National Association of Plan Advisors). “Schlichter Bogard Unleashes a New ERISA Suit Genre.” December 2025. napa-net.org.
    4. Aon plc. “U.S. Employer Health Care Costs Expected to Rise 9.5 Percent in 2026.” September 2025. aon.mediaroom.com. Projected costs exceeding $17,000 per employee.
    5. Kaiser Family Foundation. “2025 Employer Health Benefits Survey.” October 2025. kff.org. Average single premium $9,325; average deductible for firms with 10-199 workers: $2,631.
    6. Buchanan Ingersoll & Rooney PC. “New Wave of ERISA Class Action Lawsuits Name Brokers as Defendants.” January 2026. bipc.com.
    7. Plan Sponsor Council of America (PSCA). “New Wave of ERISA Litigation Targets Voluntary Benefits.” December 2025. psca.org.
    8. National Association of Professional Employer Organizations (NAPEO). “PEO Industry Research & Data.” 2025. napeo.org.

    This analysis is provided for educational purposes and does not constitute financial or legal advice. The ERISA litigation landscape is evolving rapidly. Consult your ERISA counsel for guidance specific to your plan structure and voluntary benefits program.


    About the Author

    Sam Newland, CFP® is the Founder and President of Business Insurance Health and PEO4YOU. With 13+ years in the employee benefits industry and experience as the #1 face-to-face health benefits agent nationally, Sam built BIH on a transparency-first philosophy: “What Most Brokers Can’t — or Won’t — Show You.” Contact: [email protected] | 857-255-9394

  • How Logistics Companies Cut Benefits Costs Without Losing Their Best Drivers

    How Logistics Companies Cut Benefits Costs Without Losing Their Best Drivers

    Logistics company employee benefits strategy showing cost reduction and driver retention improvements

    Logistics companies face a unique benefits challenge: high costs, high turnover, and thin margins.

    Your best driver just gave two weeks’ notice. Not because the pay was bad. Because the company across town offers dental coverage and a 401(k) match.

    If you run a logistics company with 5 to 50 drivers, you already know the math is brutal. Logistics company employee benefits feel like a luxury when your margins are thin, your workers’ comp premiums are high, and Indeed is charging you $300 to $400 every time you need to replace a CDL driver.

    But here is the math you might not know: the cost of not offering competitive benefits is almost certainly higher than the cost of offering them — if you structure them correctly.

    Key Takeaways

    • Large truckload carriers report annual driver turnover above 90%1 — each replacement costs $8,000 to $12,000 in recruiting, training, and lost productivity.
    • The FICA Recapture Method uses a Section 125 cafeteria plan with a fixed indemnity overlay to save employers $60 to $100 per employee per month in payroll taxes — without changing take-home pay.
    • A PEO consolidation can replace 3 to 5 separate vendor relationships (payroll, benefits, workers’ comp, 401(k), compliance) while reducing total cost 15% to 25%.2
    • Taft-Hartley multiemployer plans offer logistics companies renewal stability under 3%, compared to 7% to 9% for small group fully insured plans.3
    • Combined FICA recapture + PEO consolidation can save a 7-employee logistics company $15,000 to $30,000 per year — enough to fund a full benefits package that drives retention.

    The Real Cost of Driver Turnover in Logistics

    The American Trucking Associations reported that the trucking industry employed 3.58 million professional drivers in 2024, with large truckload carriers experiencing turnover rates above 90%.1 For smaller fleet operators and FedEx contractors with 5 to 20 drivers, turnover is typically lower but the per-driver replacement cost is proportionally higher because there is no HR department to absorb the work.

    When we model turnover costs for small logistics companies at BIH and PEO4YOU, the numbers look like this:

    Turnover Cost Component Per Driver
    Indeed/recruiting advertising $300–$500
    Background check + drug screening $150–$300
    Onboarding and training (2–3 weeks) $2,000–$4,000
    Productivity loss during ramp-up (4–8 weeks) $3,000–$5,000
    Administrative time (owner/manager) $500–$1,000
    Route coverage gaps (missed deliveries) $1,000–$2,500
    Total cost per driver turnover $7,000–$13,300

    BIH model estimate based on small fleet operator analysis. Route coverage and productivity loss are the largest hidden components.

    For a 7-driver operation losing 2 to 3 drivers per year, that is $14,000 to $40,000 annually in turnover costs. Now compare that to the cost of a benefits package that keeps those drivers: $10,000 to $20,000 per year for a PEO-bundled solution. The math speaks for itself.

    The FICA Recapture Method: How Logistics Companies Fund Benefits Without Raising Costs

    FICA Recapture Method showing Section 125 payroll tax savings for logistics company with 7 employees
    The FICA Recapture Method turns existing payroll taxes into a benefits funding source.

    Here is a strategy that most logistics company owners have never heard of, and it is the single fastest way to free up cash for benefits.

    Under IRS Section 125, a cafeteria plan allows employees to elect certain benefits on a pre-tax basis. When benefits are paid pre-tax, both the employer and employee avoid FICA taxes — that is 7.65% savings on each side.4

    When you layer a fixed indemnity plan (a supplemental health product) into a Section 125 structure, the savings compound:

    Hidden Math: The FICA Recapture Method for a 7-Employee Logistics Company

    Model employer: Logistics contractor, 5 W-2 drivers + 2 admin, average salary $48,000

    Step 1: Fixed indemnity plan election per employee $200/month pre-tax
    Step 2: Employer FICA savings (7.65% × $200 × 7 employees × 12 months) $1,285/yr
    Step 3: Employee FICA savings (same calculation, per employee) $184/yr per employee
    Step 4: Additional fixed indemnity benefit value per employee $2,400/yr in supplemental coverage
    Total employer savings $1,285/yr minimum
    Per-employee benefit gained $184 tax savings + $2,400 supplemental coverage

    At higher election levels ($400–$600/month where salary supports it), the employer savings scale to $2,500–$5,000/yr. BIH model estimate. Exact savings depend on election amounts and employee wage levels. Employees earning above the Social Security wage base ($176,100 in 2025) save on the Medicare portion only (1.45%).

    The real power of the FICA Recapture Method: it creates a new benefits line item from money that was already leaving the company as payroll taxes. The employer saves on FICA. The employee gets supplemental coverage and tax savings. Nobody’s take-home pay goes down.

    This is the kind of strategy that separates reactive benefits decisions from proactive ones. For more on how this approach works at scale, see cutting costs while maintaining quality.

    Why Logistics Companies Are Switching to PEO Models

    A typical small logistics company manages benefits across multiple disconnected platforms: QuickBooks for payroll, a separate 401(k) provider, an individual workers’ comp policy, and either no health benefits or an expensive small group plan with no carrier leverage.

    Each vendor has its own admin portal, its own renewal cycle, and its own fee structure. The total cost of this fragmented setup is consistently 15% to 25% higher than a consolidated PEO health coverage model.2

    Cost comparison between fragmented vendor setup and PEO consolidation for 7-employee logistics company
    Fragmented vs. consolidated: the total cost difference grows with each additional vendor.
    Cost Category Fragmented (Current) PEO Consolidated
    Health coverage (7 employees) $65,000–$80,000 $50,000–$65,000
    Payroll processing $3,000–$5,000 Included
    Workers’ comp $8,000–$15,000 $6,000–$11,000
    401(k) admin $1,500–$3,000 Included
    HR compliance / handbook $2,000–$4,000 Included
    PEO admin fee N/A $6,300–$10,500
    Annual total $79,500–$107,000 $62,300–$86,500
    Annual savings with PEO $15,000–$25,000 (15%–25%)

    BIH model estimate for 7-employee logistics company, Massachusetts market. Workers’ comp rates vary significantly by state and claims history. Health coverage savings assume transition from small group to large-group PEO rates.

    How Benefits Drive Driver Retention in Logistics

    SHRM’s 2025 Employee Benefits Survey found that 88% of employers rate health coverage as a “very important” or “extremely important” factor in job satisfaction.5 In logistics, where the labor pool is tight and the work is physically demanding, benefits are a direct retention tool.

    Here is what we have seen work for logistics companies that implement comprehensive benefits through a PEO or Taft-Hartley multiemployer arrangement:

    • Turnover reduction of 20% to 40% within the first 12 months2
    • Recruiting cost savings of $2,400 to $8,000 per year (fewer Indeed postings, faster fills)
    • Workers’ comp savings of 10% to 20% through PEO loss control programs and pay-as-you-go billing

    For the driver who left because the competitor offered dental, the fix was not a $5,000 raise. It was a $200 per month benefits package — that is $2,400 per year to retain a driver who costs $8,000 to $12,000 to replace. That is a 3:1 to 5:1 return on investment.

    Understanding what 100% employee-paid benefits really means can help logistics companies structure packages that feel valuable to drivers without crushing the company’s margins.

    Taft-Hartley Plans: The Logistics Industry’s Best Kept Secret

    Most logistics benefits conversations stop at “fully insured or self-funded.” But for companies with 5 to 50 employees, Taft-Hartley multiemployer plans offer a third path that delivers large-group stability without large-group size.

    The mechanics: a collectively bargained trust pools your employees with workers from other participating employers. The larger pool means:

    • Premium renewals consistently under 3% annually compared to 7% to 9% for small group fully insured3
    • No single high-cost claimant can blow up your rates — the risk is spread across the entire trust
    • BCBS PPO networks with $1,000 deductibles and $3,800 out-of-pocket maximums — plan quality that small logistics companies cannot access individually
    • ACA compliance handled by the trust — one less thing for the owner to manage

    This is a strategy that PEO4YOU specializes in. The trust structure requires specific legal setup, but for logistics companies tired of 9% annual renewal shocks, it is the most reliable path to premium stability.

    For startups in the logistics space still building their team, see our framework for when to start offering startup employee benefits.

    “In logistics, the company that offers benefits does not just reduce turnover. It gets first pick of the driver pool. When every competitor is offering the same pay rate, benefits become the tiebreaker — and the tiebreaker wins.”

    — Based on BIH client analysis of small fleet operators with and without benefits packages

    📊 MODEL YOUR LOGISTICS COMPANY’S BENEFITS COSTS

    Premium Renewal Stress Test at businessinsurance.health

    See how your health benefits costs project over 6 years under 5 funding strategies — including PEO, Taft-Hartley, and level-funded options.

    No login required. No email gate. Free.

    Like this tool? We built five more just like it — all free, all ungated. Explore all tools at BIH.

    Frequently Asked Questions

    Can a FedEx contractor or small fleet operator qualify for PEO health coverage?

    Yes. PEOs work with companies as small as 5 W-2 employees in most states. For FedEx contractors, the PEO becomes the co-employer of record, handling payroll, benefits, workers’ comp, and compliance. The contractor maintains operational control of routes and drivers. This is a common arrangement for logistics companies that want to attract and retain talent without building an HR department.

    How does the Section 125 FICA savings actually work for logistics companies?

    Under IRS Section 125, employees elect to pay for qualifying benefits (health premiums, supplemental coverage, FSA contributions) with pre-tax dollars. Both the employer and employee avoid the 7.65% FICA tax on those elections.4 For a logistics company with 7 employees averaging $200/month in pre-tax elections, the employer saves approximately $1,285/year. At higher election levels, savings scale to $2,500 to $5,000/year. The employee gains tax savings and supplemental coverage with no reduction in base pay.

    What benefits do logistics drivers value most?

    Based on BIH client analysis across logistics companies: (1) health coverage with low out-of-pocket costs, (2) dental and vision coverage, (3) disability coverage (critical for drivers whose income depends on physical ability), and (4) 401(k) with employer match. The first three are typically the deciding factor when a driver chooses between two similarly paying positions.

    Is a Taft-Hartley plan realistic for a company with only 5 to 10 drivers?

    Yes — that is exactly the size range where Taft-Hartley multiemployer plans provide the most value. The trust pools your 5 to 10 employees with hundreds or thousands of workers from other participating employers, giving you the rate stability and plan quality of a Fortune 500 company. Minimum enrollment is typically 5 employees. PEO4YOU connects small logistics companies to these trust arrangements.

    How quickly can a logistics company implement a PEO and start offering benefits?

    Typical implementation takes 2 to 4 weeks from signed agreement to first payroll. Health coverage can be effective on the first of the following month. Workers’ comp transfers immediately upon PEO start date. Most logistics companies complete the transition without any disruption to driver operations or pay schedules.

    📊 CALCULATE YOUR FICA SAVINGS

    Benefits Savings Strategy Builder at businessinsurance.health

    Model 32+ savings strategies including Section 125 FICA recapture, PEO consolidation, and Taft-Hartley trust options — with 90% confidence intervals on every projection.

    No login required. No email gate. Free.

    Like this tool? We built five more just like it — all free, all ungated. Explore all tools at BIH.

    References

    1. American Trucking Associations. “ATA American Trucking Trends 2025.” 2025. trucking.org. 3.58 million professional drivers in 2024; large truckload carrier turnover above 90%.
    2. National Association of Professional Employer Organizations (NAPEO). “PEO Industry Research & Data.” 2025. napeo.org. PEO users report double median revenue growth, 16% higher profitability, 27.2% average ROI.
    3. Kaiser Family Foundation. “2025 Employer Health Benefits Survey.” October 2025. kff.org. Average single premium $9,325; family $26,993. Small group fully insured renewal averages 7%–9% for mid-size employers.
    4. Internal Revenue Service. “FAQs for Government Entities Regarding Cafeteria Plans — Section 125.” irs.gov. Employer and employee FICA rate: 7.65% (6.2% Social Security + 1.45% Medicare).
    5. SHRM. “2025 Employee Benefits Survey.” shrm.org. 88% of employees rate health coverage as very/extremely important.
    6. Bureau of Labor Statistics. “Employer Costs for Employee Compensation — September 2025.” bls.gov. Total compensation $46.84/hr; benefits 29.7%.
    7. altLINE/NPR. “Is There a Truck Driver Shortage in the U.S. in 2025?” November 2025. altline.sobanco.com. Long-haul trucker annual turnover rate above 90% at many large companies.
    8. Investopedia. “Understanding Section 125 Cafeteria Plans.” October 2025. investopedia.com. Employers save 7.65% on their share of payroll taxes through Section 125 elections.

    This analysis is provided for educational purposes and does not constitute financial or legal advice. Consult your compliance counsel and benefits advisor for guidance specific to your situation. Turnover cost estimates are BIH model calculations based on industry data and client analysis. FICA savings depend on employee election levels and wage thresholds. All projections are presented as ranges.


    About the Author

    Sam Newland, CFP® is the Founder and President of Business Insurance Health and PEO4YOU. With 13+ years in the employee benefits industry and experience as the #1 face-to-face health coverage agent nationally, Sam built BIH on a transparency-first philosophy: “What Most Brokers Can’t — or Won’t — Show You.” Contact: [email protected] | 857-255-9394

  • When Should Your Startup Actually Start Offering Health Benefits?

    When Should Your Startup Actually Start Offering Health Benefits?

    Startup employee benefits timing decision framework showing when to offer health coverage

    Timing your benefits launch can save $5,000–$15,000 in the first year alone.

    You just signed your lease. You are building out the space. You have your first three hires lined up. And someone told you that you need to offer health coverage to attract talent.

    That advice is not wrong. But the timing of when you launch a startup employee benefits package can mean the difference between a smart investment and lighting $5,000 to $15,000 on fire in your first year.

    Here is what most startup guides get wrong: they treat benefits as a binary decision. You either offer them or you don’t. In reality, the decision is sequential, and getting the sequence wrong creates problems that compound for years.

    Key Takeaways

    • Starting a group health plan with only the founder locks in higher rates based on the oldest member’s age, making future coverage more expensive for younger hires.
    • The average annual premium for single coverage reached $9,325 in 20251 — a significant line item for a startup with 3 to 10 employees.
    • A PEO can provide Fortune 500 level benefits at zero direct cost to the business through pooled purchasing power and bundled HR services.2
    • The Benefits Timing Matrix maps your employee count, revenue stage, and hiring timeline to the right benefits strategy — not every startup should launch benefits on day one.
    • Taft-Hartley multiemployer plans offer an alternative path for startups that need benefits but cannot meet minimum enrollment requirements.

    Why Most Startups Get Health Coverage Timing Wrong

    Consider a scenario we see regularly at BIH and PEO4YOU: a founder in their late 40s is opening a boutique service business. They plan to hire 5 to 10 employees over the next six months, most of them in their 20s and 30s.

    The founder’s instinct? Set up a group health plan immediately so the benefits are ready when the first hire starts.

    Here is the problem. When you start a group plan with only the founder enrolled, the baseline rate is set by the oldest member — the founder. In a community-rated state, age is one of the few factors carriers can use to adjust premiums. A 49 year old pays roughly 2.5 to 3 times what a 21 year old pays under ACA age-banding rules.3

    The result: your 28 year old hire’s individual plan through the ACA Marketplace might cost $350 per month. The group plan you just started? Their share might be $450 or more because your age is pulling the group average up.

    You just made benefits more expensive for the people you are trying to attract.

    The Benefits Timing Matrix: A Framework for Startup Employee Benefits

    Benefits Timing Matrix framework for startup employee benefits decisions based on stage and headcount
    The Benefits Timing Matrix: match your benefits strategy to your growth stage.

    When we model this for startups at BIH, we use what we call The Benefits Timing Matrix. It maps three variables to determine the right strategy:

    Stage Headcount Recommended Strategy Why
    Pre-Launch Founder only Individual/Marketplace plan No group rate benefit with 1 person; ACA subsidies may apply
    First Hires 1–4 W-2 QSEHRA or ICHRA Reimburse individual plans; no minimum participation requirements
    Growth 5–15 W-2 PEO or Taft-Hartley trust Access large-group rates; bundled HR/compliance; minimal admin burden
    Scale 15–50+ W-2 Group plan or level-funded Enough lives to negotiate; claims data starts to matter

    The critical insight: the jump from “First Hires” to “Growth” is where most startups waste money. They skip the middle options and go straight to a group plan before they have enough employees to make it cost-effective.

    What a PEO Actually Does for a Startup (And What It Costs)

    Professional Employer Organizations get a lot of attention in the employee benefits for small business conversation, but the specifics matter for startups.

    Here is what the data shows: businesses that use a PEO have double the median revenue growth and a 16% increase in profitability compared to similar non-PEO firms.2 For a startup, that growth differential is existential.

    What does a PEO bundle look like for a startup with 5 to 10 employees?

    • Health coverage — access to large-group rates typically reserved for companies with 100+ employees
    • Disability and life coverage — often included at no additional cost, solving the minimum enrollment problem that prevents small firms from offering voluntary benefits
    • 401(k) — with institutional fund options and lower admin fees than standalone plans
    • Workers’ compensation — with pay-as-you-go billing (no large annual deposit)
    • Payroll and compliance — handled by the PEO, freeing the founder to focus on revenue

    The typical PEO fee for a startup ranges from $900 to $1,500 per employee per year, or roughly $75 to $125 per employee per month.4 Compare that to the cost of assembling these services individually:

    Hidden Math: The Startup Benefits Assembly Cost

    Model employer: Service business, 7 employees, average salary $45,000

    Group health coverage (small group, no leverage) $65,000–$75,000/yr
    Payroll service $2,500–$4,000/yr
    Workers’ comp (annual deposit + premium) $3,000–$8,000/yr
    401(k) administration $1,500–$3,000/yr
    HR compliance/handbook $2,000–$5,000/yr
    Total assembled cost $74,000–$95,000/yr

    PEO bundled cost for 7 employees: $55,000–$75,000/yr (health premiums at large-group rates + PEO admin fee)

    Net savings: $10,000–$25,000/yrBIH model estimate based on client analysis across similar-sized startups.

    The W-2 vs. 1099 Decision Shapes Your Benefits Strategy

    For startups in industries with flexible work arrangements — fitness studios, creative agencies, consulting firms, professional services — the W-2 versus 1099 classification directly impacts your benefits options.

    Only W-2 employees qualify for employer-sponsored group health plans. If your workforce is a mix of W-2 and 1099, you need a strategy that works for both without creating resentment.

    Options for the mixed workforce:

    1. PEO for W-2 staff — full benefits suite through pooled purchasing
    2. Stipend or ICHRA for 1099 contractors — fixed monthly amount toward their own individual coverage (consult tax counsel on compliance)
    3. Section 125 overlay — for W-2 employees, reduces FICA taxes by 7.65% on both the employer and employee side for qualifying pre-tax benefits5

    The Section 125 overlay alone can save a startup with 7 W-2 employees $3,800 to $6,500 per year in FICA taxes — money that was already leaving the building.5

    When Taft-Hartley Plans Solve the Startup Benefits Problem

    Most startup guides never mention Taft-Hartley multiemployer plans, and that is a missed opportunity. These union trust arrangements pool multiple small employers to achieve the same rate stability and purchasing power as Fortune 500 companies.

    For a startup, the advantages are specific:

    • Minimum enrollment as low as 5 employees — below most group plan minimums in many states
    • Renewal increases consistently under 3% compared to the 7% to 9% average for small group fully insured plans1
    • ACA compliance built in — the trust handles reporting requirements
    • No age-banding penalty — the pool is large enough that one older founder does not skew rates

    This is a strategy that PEO4YOU implements regularly for small businesses that need premium stability from day one. The tradeoff: Taft-Hartley plans require a collectively bargained trust structure, which involves specific legal requirements. It is not self-service — you need a benefits advisor who understands the structure. That is exactly what PEO health coverage for small businesses is designed to navigate.

    “The startup that waits until it has 15 employees to think about benefits strategy has already overpaid by $15,000 to $30,000. The one that plans at 3 employees saves that money and attracts better talent.”

    — BIH model estimate based on 3-year cost projections for service-industry startups

    📊 MODEL YOUR OWN BENEFITS COSTS

    Premium Renewal Stress Test at businessinsurance.health

    See how your benefits costs project across 6 years under 5 different funding strategies — including PEO, level-funded, and Taft-Hartley options.

    No login required. No email gate. Free.

    Like this tool? We built five more just like it — all free, all ungated. Explore all tools at BIH.

    The Real Cost of Getting Startup Employee Benefits Wrong

    Comparison of PEO bundled benefits versus assembled group plan costs for startup with 7 employees
    Assembled vs. bundled: the cost gap widens as headcount grows.

    According to the Bureau of Labor Statistics, employer costs for employee compensation averaged $46.05 per hour worked in September 2025, with benefits accounting for 29.7% of total compensation.6 For startups competing for talent against larger employers, benefits are not optional — they are table stakes.

    But the small business health benefits cost equation is different for companies with fewer than 50 employees. You have no ACA mandate. You have no leverage with carriers. And every dollar you overspend on benefits is a dollar that does not fund growth.

    The cost of getting the timing wrong compounds across three dimensions:

    1. Rate lock-in: Starting a group plan too early sets a baseline that carriers adjust from — not to. Year-over-year increases compound on a higher base.
    2. Admin burden: Managing separate payroll, benefits, workers’ comp, and compliance vendors when a PEO could bundle them at lower total cost.
    3. Talent loss: SHRM’s 2025 Employee Benefits Survey found that 88% of employers rate health coverage as a “very important” or “extremely important” benefit.7 If you cannot offer competitive benefits because you are overpaying on a poorly structured plan, you lose the people you need most.

    A Better Approach: The Startup Benefits Launch Sequence

    Based on what we have seen work across dozens of startup engagements at BIH and PEO4YOU, here is the sequence that minimizes cost while maximizing talent attraction:

    1. Day 1 (founder only): Stay on your individual plan. Do not start a group plan.
    2. First W-2 hire: Set up a QSEHRA to reimburse up to $6,350 (individual) or $12,800 (family) in 2025 for individual plan premiums.8
    3. At 5 W-2 employees: Evaluate PEO versus Taft-Hartley versus small group. Run the numbers on all three — the right answer depends on industry, employee demographics, and state.
    4. At 5+ employees with PEO: Layer a Section 125 plan for additional FICA savings of 7.65% on qualifying pre-tax benefits.
    5. At 15+ employees: Evaluate transitioning to a standalone group plan or level-funded arrangement where you retain claims surplus.

    This sequence saves a typical service-industry startup $12,000 to $28,000 over the first three years compared to launching a group plan on day one. BIH model estimate based on 7-employee service business, average salary $45,000, Massachusetts market rates.

    For logistics companies and contractors navigating similar decisions, see our guide on logistics company employee benefits where driver retention creates unique benefits challenges.

    Frequently Asked Questions

    How many employees do I need before offering health coverage makes sense?

    There is no legal requirement for companies under 50 employees to offer health coverage. However, the economic case for benefits typically becomes compelling at 5 or more W-2 employees, where PEO and Taft-Hartley multiemployer plan options unlock large-group purchasing power. Below 5, a QSEHRA or ICHRA lets you subsidize individual plans without the overhead of a group plan.

    Can a startup with mostly 1099 contractors still offer benefits?

    Not through a traditional group health plan — only W-2 employees qualify. However, you can offer health stipends, wellness benefits, or educational benefits to contractors. For W-2 employees, a PEO provides a full benefits suite even with just a few enrolled. The key is structuring your workforce classification correctly with a benefits advisor and employment counsel.

    What is the difference between a PEO and a traditional benefits broker for a startup?

    A traditional broker finds you a health plan. A PEO bundles health coverage, payroll, workers’ comp, HR compliance, and retirement plans into a single co-employment relationship. For startups with fewer than 15 employees, the PEO model typically costs 15% to 25% less than assembling these services separately. Use the Premium Renewal Stress Test to model the difference over 6 years.

    Should I delay benefits to save money if I am bootstrapping?

    Delaying benefits is not the same as ignoring them. The Benefits Timing Matrix shows that the smartest bootstrapped startups use QSEHRA reimbursements during the founder-only phase, then transition to a PEO or multiemployer plan at 5 employees. This approach costs 40% to 60% less in years 1 through 3 than launching a group plan immediately.

    How does a Taft-Hartley plan work for a small startup?

    A Taft-Hartley multiemployer plan pools your employees with those from other small businesses under a collectively bargained trust. The pool achieves large-group stability: renewal increases consistently under 3%, compared to 7% to 9% for small group fully insured plans.1 Minimum enrollment is typically 5 employees, and ACA compliance is handled by the trust. PEO4YOU specializes in connecting small businesses to these trust arrangements.

    📊 SEE WHAT YOUR BENEFITS SHOULD ACTUALLY COST

    Benefits ROI Calculator at businessinsurance.health

    Model 42 different benefits across 9 institutional data sources to see exactly what your startup should be spending — and where the savings are hiding.

    No login required. No email gate. Free.

    Like this tool? We built five more just like it — all free, all ungated. Explore all tools at BIH.

    References

    1. Kaiser Family Foundation. “2025 Employer Health Benefits Survey.” October 2025. kff.org. Average single premium: $9,325; family: $26,993. Small group fully insured renewal averages 7%–9% for mid-size employers.
    2. National Association of Professional Employer Organizations (NAPEO). “PEO Industry Research & Data.” 2025. napeo.org. PEO users show double median revenue growth and 16% higher profitability; average ROI 27.2%.
    3. Centers for Medicare & Medicaid Services. “Age Curve — ACA Age Rating.” cms.gov. ACA allows age-based rating of up to 3:1 ratio between oldest and youngest adults.
    4. NAPEO. “PEO Clients: 2025 White Paper.” October 2025. napeo.org. PEO fee estimates based on industry analysis of small business clients.
    5. Internal Revenue Service. “FAQs for Government Entities Regarding Cafeteria Plans — Section 125.” irs.gov. Employer FICA savings: 7.65% on qualifying pre-tax benefit elections.
    6. Bureau of Labor Statistics. “Employer Costs for Employee Compensation — September 2025.” ECEC. bls.gov. Total compensation: $46.84/hr; benefits: 29.7%.
    7. SHRM. “2025 Employee Benefits Survey.” shrm.org. 88% of employees rate health coverage as very/extremely important.
    8. Internal Revenue Service. “Qualified Small Employer Health Reimbursement Arrangements (QSEHRAs).” irs.gov. 2025 limits: $6,350 individual / $12,800 family.

    This analysis is provided for educational purposes and does not constitute financial or legal advice. Consult your compliance counsel and benefits advisor for guidance specific to your situation. All projections are BIH model estimates based on typical service-industry startups in the Northeast market and presented as ranges to reflect variability.


    About the Author

    Sam Newland, CFP® is the Founder and President of Business Insurance Health and PEO4YOU. With 13+ years in the employee benefits industry and experience as the #1 face-to-face health coverage agent nationally, Sam built BIH on a transparency-first philosophy: “What Most Brokers Can’t — or Won’t — Show You.” Contact: [email protected] | 857-255-9394

  • Health Plans for Small Manufacturers: How to Cut Costs Without Cutting Coverage

    Health Plans for Small Manufacturers: How to Cut Costs Without Cutting Coverage

    Key Takeaways

    • Rising healthcare and benefits costs are the second-greatest business challenge for manufacturers, according to the NAM Q4 2025 Manufacturers’ Outlook Survey.¹
    • Average employer health coverage cost per employee is projected to surpass $17,000 in 2026, a 9.5% increase from 2025.²
    • Small manufacturers with 15 to 50 employees are often stuck in the worst pricing tier: too large to qualify as micro-groups but too small to negotiate meaningful carrier discounts.
    • Four funding strategies can reduce healthcare costs by 20% to 30% without downgrading coverage quality: PEO arrangements, multiemployer trusts, level-funded plans, and Section 125 wellness overlays.
    • The smartest manufacturers are treating health plan savings as a reinvestment fund for employee wages, not just a cost reduction exercise.

    You run a manufacturing operation with 20 employees. Your health plan costs $130,000 a year. The plan has 50% coinsurance and a $10,000 out of pocket maximum. You’re paying 80% of the premium, and your employees are still one hospital visit away from a $5,000 bill they can’t afford.

    Does that sound like a good deal to anyone?

    It shouldn’t. Because across the manufacturing sector, companies like yours are overpaying for health coverage that underdelivers. And the worst part: most brokers keep presenting the same three options every year. The same carrier at a higher rate. A different carrier at a slightly lower rate. Or a higher deductible plan to “offset” the increase.

    There are better options. And they don’t require you to cut benefits.

    Why Manufacturers Get Hit Harder on Health Coverage

    Manufacturing companies face a specific combination of factors that drive healthcare costs higher than many other industries:

    Physical job demands create claims. Even in modern manufacturing facilities, workers face musculoskeletal injuries, repetitive motion issues, and occasional acute injuries. These claims show up in your experience rating and drive renewal increases.

    Smaller groups get worse pricing. A manufacturer with 20 employees has virtually no negotiating leverage with carriers. According to the KFF 2025 survey, average annual premiums reached $9,325 for single coverage and $26,993 for family coverage.³ Small groups typically pay above these averages because carriers price in higher risk and lower administrative efficiency.

    Workforce demographics skew older. Manufacturing workforces often include experienced tradespeople in their 40s, 50s, and 60s. In community-rated states, age doesn’t directly affect premiums. But in states with age banding, older workforces pay significantly more.

    Tariff uncertainty compounds the pressure. The NAM Q4 2025 survey found that rising healthcare costs have become the second-greatest business challenge for manufacturers, behind only an unfavorable business climate.¹ Companies that have already absorbed 20% to 25% revenue hits from tariff disruptions cannot absorb another 10%+ on healthcare costs.

    Small manufacturers squeezed between rising health insurance costs and economic uncertainty
    Small manufacturers face cost pressure from multiple directions. Source: NAM Q4 2025, KFF 2025

    The Benefits Reinvestment Strategy: Save on Benefits Costs, Invest in People

    Here’s what separates good companies from great ones in manufacturing: the great ones don’t treat health plan savings as profit. They reinvest it.

    We call this The Benefits Reinvestment Strategy. When a company saves $25,000 to $40,000 on health coverage through smarter funding, the best use of that money is:

    1. Reduce employee cost-sharing (lower deductibles, better coinsurance)

    2. Add dental and vision (often requested, frequently skipped due to cost)

    3. Fund wage increases that improve retention

    4. Create an HRA that covers employee out of pocket costs

    A manufacturer we worked with put it this way: the goal isn’t to cut costs to increase company profit. It’s to stop overpaying insurers so you can put that money back into the people who actually run your operation.

    That philosophy is especially important in manufacturing, where skilled workers are increasingly difficult to find and expensive to replace. The cost of losing one experienced machinist, welder, or line supervisor far exceeds any annual savings on health premiums.

    Four Funding Strategies That Work for Small Manufacturers

    Strategy 1: PEO (Professional Employer Organization)

    A PEO combines your employees with thousands of others into a single large group for benefits purchasing. This gives a 20 employee manufacturer access to the same health plans, rates, and voluntary benefits as a Fortune 500 company.

    How it works for manufacturers:

    • Your employees join the PEO’s master health plan
    • You get access to multiple carrier options (typically UHC, Aetna, or Blue Cross Blue Shield networks)
    • Workers’ compensation is included and often significantly cheaper through PEO group rates
    • Payroll, HR compliance, and benefits administration are bundled

    Cost impact: PEO admin fees typically run $40 to $160 per employee per month, but the health plan savings, workers’ comp reductions, and HR time savings often produce a net positive ROI. NAPEO research shows PEO clients grow twice as fast, have 12% lower employee turnover, and are 50% less likely to go out of business.⁴

    Best for: Manufacturers with 10 to 40 employees who want comprehensive HR support alongside better benefits. Read more about PEO health coverage options.

    Strategy 2: Taft-Hartley Multiemployer Trust

    This is the option most brokers never mention. A multiemployer trust pools thousands of employees across hundreds of small companies, creating the buying power of a large employer.

    Key advantages for manufacturers:

    • Fixed rates regardless of your company’s claims experience
    • Rate increases averaging 3% or less for six consecutive years in established trusts (vs. industry average of 6% to 9%)
    • Blue Cross Blue Shield nationwide network
    • Bundled dental, vision, life, and accident coverage
    • First-dollar copays on primary care (no deductible required for routine visits)
    • No formulary restrictions on prescriptions (any medication covered)

    Cost impact: For a manufacturer paying $130,000 per year for 20 employees on a 50% coinsurance plan, a multiemployer trust typically offers richer benefits (20% coinsurance, lower out of pocket maximum) at comparable or lower cost. The savings come from the trust’s massive risk pool and non-profit structure.

    Best for: Manufacturers with 5 to 50 employees seeking premium stability and richer benefits.

    Strategy 3: Level-Funded Plan

    A level-funded plan gives you fixed monthly payments like fully insured, but with transparency and potential upside. If your group has a healthy year with low claims, you get money back.

    Key advantages for manufacturers:

    • Claims data transparency (so you actually know what’s driving costs)
    • Potential year-end refund if claims are low
    • Stop-loss coverage caps maximum exposure
    • Multiple carrier networks available (Aetna, UHC, Cigna)

    Cost impact: Level-funded plans typically save 5% to 15% compared to fully insured in the first year, with the potential for additional savings through refunds. More importantly, the claims data you receive enables smarter plan design decisions for future years.

    Best for: Manufacturers with 25 to 75 employees and reasonably healthy workforces who want data visibility. Read our guide on when to transition from fully insured to self-funded.

    Strategy 4: Section 125 Wellness Overlay

    This isn’t a health plan. It’s a tax savings strategy that layers on top of whatever health plan you already have. A Section 125 wellness plan reduces employer FICA taxes by $900 to $1,400 per employee per year while simultaneously increasing employee take-home pay by 2% to 5%.⁵

    Key advantages for manufacturers:

    • Works alongside any health plan (PEO, multiemployer, fully insured, or self-funded)
    • Savings are based on FICA tax math, not claims experience
    • Employees get telehealth, behavioral health, prescriptions, and EAP services
    • No medical underwriting required

    Cost impact: For a 20 employee manufacturer, annual employer savings of $15,000 to $28,000 after program fees.

    Best for: Any manufacturer with 20+ employees, regardless of current health plan. Stack this with any of the other three strategies.

    📊 MODEL YOUR SAVINGS BY STRATEGY

    Benefits Savings Strategy Builder at businessinsurance.health — explore 32+ cost reduction strategies for your specific headcount and industry.

    No login required. No email gate. Free.

    Like this tool? We built five more just like it — all free, all ungated. Explore all tools at Business Insurance Health.

    Four health insurance funding strategies compared for small manufacturers showing costs and benefits
    Four funding strategies that can reduce manufacturer healthcare costs by 20% to 30%

    The Hidden Math: What a 20 Employee Manufacturer Can Actually Save

    Model Employer: Small Manufacturer

    Parameter Value Source
    Industry Manufacturing (craft production) Scenario
    Employees 20 Scenario
    Current plan Fully insured, 50% coinsurance, $10K OOP max Based on typical small group
    Current annual cost (employer 80%) $130,000 Scenario
    Average employee salary $48,000 BLS manufacturing median⁶

    Annual Cost Comparison by Strategy

    Strategy Est. Annual Cost Savings vs. Current Employee Benefit Improvement
    Current (fully insured) $130,000 Baseline 50% coinsurance, $10K OOP max
    PEO arrangement $100,000 to $115,000 $15,000 to $30,000 20% coinsurance, lower OOP, dental/vision included
    Multiemployer trust $95,000 to $118,000 $12,000 to $35,000 First-dollar copays, 20% coinsurance, full Rx coverage
    Level-funded $110,000 to $125,000 $5,000 to $20,000 Similar benefits + claims data + potential refund
    Section 125 overlay (add-on) Saves $15,000 to $28,000 Stacks with above Telehealth, behavioral health, Rx, EAP

    BIH model estimate based on market rates for manufacturing groups of 15 to 30 employees. Actual costs depend on employee demographics, location, claims history, and plan design. All figures represent ranges.

    Combined Strategy: PEO or Multiemployer Trust + Section 125

    Metric Conservative Moderate
    Health plan savings $12,000 $30,000
    Section 125 FICA savings $15,000 $28,000
    Total annual savings $27,000 $58,000
    Savings per employee $1,350 $2,900
    Employee take-home increase $1,000/yr each $2,400/yr each

    That $27,000 to $58,000 in annual savings? That’s your reinvestment fund. Better dental coverage. A $500 HRA for each employee. A $1/hour wage increase across the board. Whatever makes the biggest difference for retention.

    Before and after health insurance optimization for small manufacturer showing cost and coverage improvements
    The same 20-employee manufacturer before and after funding strategy optimization

    What to Do This Week (Three Steps)

    Step 1: Get Your Current Numbers

    Pull your most recent renewal letter and benefits summary. You need: annual premium, employer contribution percentage, deductible, coinsurance, out of pocket maximum, and which carrier/plan you’re on. If you don’t have this, your broker should send it within 24 hours.

    Step 2: Run a Side-by-Side Comparison

    Use the Premium Renewal Stress Test to model your current plan against alternative funding strategies over six years. This shows you not just Year 1 savings but the cumulative impact of different rate increase trajectories.

    Step 3: Request a Benefits Evaluation

    If the numbers show opportunity, get a formal evaluation from a benefits consultant who works across all funding strategies (not just one carrier or one PEO). The evaluation should include PEO options, multiemployer trust eligibility, level-funded quotes, and Section 125 overlay analysis. At Business Insurance Health and PEO4YOU, we evaluate all six plan types for every client. There’s no commitment and no cost for the initial analysis.

    Frequently Asked Questions

    Do small manufacturers qualify for PEO health coverage?

    Yes. Most PEOs accept manufacturing companies with as few as 5 employees. Manufacturing is a strong fit for PEOs because of the bundled workers’ compensation benefit, which is often 15% to 30% cheaper through a PEO’s group rating than standalone policies. Some PEOs specialize in manufacturing and construction, offering features like certified payroll, prevailing wage support, and OSHA compliance assistance. Learn more about PEO health coverage.

    How much does health coverage cost per employee for a small manufacturer?

    According to the KFF 2025 survey, average annual premiums are $9,325 for single coverage and $26,993 for family coverage across all industries.³ Manufacturer-specific costs depend on workforce age, location, and plan design. For a 20 employee manufacturer with a blended single/family enrollment, annual employer costs typically range from $5,500 to $8,000 per employee (at 80% employer contribution). Projected 2026 averages may surpass $17,000 per employee including both employer and employee shares.²

    Can we bundle workers’ comp with health coverage to save money?

    Through a PEO, yes. PEOs combine payroll, health coverage, workers’ compensation, and HR administration into a single platform. The workers’ comp savings alone can be significant for manufacturers: PEO group rates are typically 15% to 30% lower than standalone policies because the PEO’s larger pool diversifies risk across many industries and employers. This is covered in our guide to cutting costs while maintaining quality.

    What is a multiemployer trust and how does it apply to manufacturers?

    A multiemployer trust (often called a Taft-Hartley plan) pools employees from hundreds of small companies into a single large group. This creates the purchasing power and risk diversification of a large employer. For manufacturers, the key benefits are premium stability (increases averaging 3% or less annually), nationwide carrier networks, and richer plan designs than the small group market offers. Minimum enrollment is typically 5 employees. See our detailed guide on how multiemployer plans offer better health coverage.

    Will changing health plans disrupt my employees?

    The transition period does require communication and enrollment, typically 30 to 60 days. However, most alternative funding strategies (PEO, multiemployer trust, level-funded) offer the same major carrier networks (Blue Cross Blue Shield, UHC, Aetna, Cigna) that your employees may already be using. In many cases, employees keep the same doctors and hospitals with better coverage at lower personal cost. The disruption is administrative, not clinical.

    📊 CALCULATE YOUR BENEFITS ROI

    Benefits ROI Calculator at businessinsurance.health — see the full financial impact of benefits improvements for your manufacturing company.

    No login required. No email gate. Free.

    Like this tool? We built five more just like it — all free, all ungated. Explore all tools at Business Insurance Health.

    References

    1. National Association of Manufacturers. “NAM Manufacturers’ Outlook Survey, Fourth Quarter 2025.” December 2025. https://nam.org/wp-content/uploads/securepdfs/2025/12/NAM_Q4_2025_Outlook_Write_Up.pdf

    2. Live Insurance News. “Small Business Health Insurance Hits Breaking Point as Costs Surge 11% in 2026.” March 2026. https://www.liveinsurancenews.com/small-business-health-insurance/8570249/

    3. Kaiser Family Foundation. “2025 Employer Health Benefits Survey.” October 2025. https://www.kff.org/health-costs/2025-employer-health-benefits-survey/

    4. National Association of Professional Employer Organizations. “Industry Research & Data.” NAPEO.org. https://napeo.org/intro-to-peos/industry-research-data/

    5. IRS. “Topic No. 751, Social Security and Medicare Withholding Rates.” IRS.gov. https://www.irs.gov/taxtopics/tc751. Section 125 savings calculated at 7.65% employer FICA rate applied to DOI-approved benefit value. See our detailed analysis in the Section 125 wellness plan savings guide.

    6. Bureau of Labor Statistics. “Occupational Employment and Wage Statistics: Production Occupations.” May 2025. https://www.bls.gov/oes/

    7. Peterson-KFF Health System Tracker. “How Much and Why Premiums Are Going Up for Small Businesses in 2026.” September 2025. https://www.healthsystemtracker.org/brief/how-much-and-why-premiums-are-going-up-for-small-businesses-in-2026/

    8. Business.com. “Average Employee Health Insurance Cost in 2026.” January 2026. https://www.business.com/articles/health-insurance-costs-this-year/

    Methodology Note: Cost comparisons in this article use a 20-employee manufacturer model with 80% employer contribution and blended enrollment (mix of single and family coverage). Current annual cost of $130,000 is based on client consultation data. Alternative strategy pricing reflects 2025-2026 market rates for manufacturing groups of 15 to 30 employees. Section 125 savings are calculated using the IRS FICA rate of 7.65% applied to a DOI-approved benefit value of $1,600 per month, with program fees of $35 to $45 per employee per month. All projections are presented as ranges.

    This analysis is provided for educational purposes and does not constitute financial or legal advice. Consult your compliance counsel and benefits advisor for guidance specific to your situation.

    About the Author

    Sam Newland, CFP® is the Founder and President of Business Insurance Health and PEO4YOU. With over 13 years in the employee benefits industry and experience as the former #1 face-to-face health benefits advisor nationally, Sam helps businesses with 30 to 200+ employees navigate funding strategies that most brokers don’t present. Contact: [email protected] | 857-255-9394 | businessinsurance.health | peo4you.com

  • When to Move from Fully Insured to Self-Funded Health Plans

    When to Move from Fully Insured to Self-Funded Health Plans

    Key Takeaways

    • In 2025, 67% of covered workers are enrolled in self-funded plans, including 27% at firms with 10 to 199 employees, up from 63% just one year prior.¹
    • The transition from fully insured to self-funded isn’t binary. Level-funded plans, group captives, and Taft-Hartley multiemployer trusts create stepping stones that reduce risk while building toward full self-funding.
    • Companies with 75 to 200 employees and clean claims history are in the sweet spot for transition. Below 50, the risk pool is often too small without a captive structure.
    • The biggest mistake employers make is switching after a bad renewal without requesting claims data first. You need 24 months of claims history to make an informed decision.
    • A well-structured transition typically saves 10% to 25% in Year 1, with compounding savings as claims data informs plan design.

    Your renewal just came in at 19%. Your broker’s recommendation: absorb it and “hope next year is better.” Or switch carriers and start the cycle over.

    If this sounds familiar, you’re living in the fully insured trap. You’re paying premiums based on the carrier’s book of business, not your actual claims experience. And every year, the carrier keeps the spread between what you paid and what they paid out in claims.

    At some point, the math stops making sense. The question is: when exactly is that point?

    What “Self-Funded” Actually Means (And Why It’s Less Scary Than It Sounds)

    In a fully insured arrangement, you pay a fixed premium to an carrier. The carrier assumes all the risk. If your employees have a good year with low claims, the carrier keeps the surplus. If claims are high, the carrier absorbs the loss. You get predictability but zero upside.

    In a self-funded arrangement, your company pays employee health claims directly. You hire a third party administrator (TPA) to process claims, and you purchase stop-loss coverage to cap your maximum exposure. If your employees have a healthy year, you keep the savings. If claims spike, the stop-loss kicks in.

    The fear most employers have is catastrophic claims. What if someone gets cancer? What if there’s a $500,000 hospital stay? That’s what stop-loss coverage is for. It comes in two forms:²

    • Specific stop-loss: Caps the cost of any single claim (typically $50,000 to $250,000 per individual)
    • Aggregate stop-loss: Caps your total annual claims liability (typically 125% of expected claims)

    With proper stop-loss in place, your maximum downside in a self-funded plan is defined and insured. The difference is that in good years, you get the upside instead of the carrier.

    Fully insured versus self-funded health insurance money flow comparison for employers
    The two paths: fully insured predictability vs. self-funded control and savings

    The Self-Funding Readiness Score: Five Factors That Determine If You’re Ready

    Not every company should self-fund. In our practice, we evaluate five factors before recommending a transition. We call this The Self-Funding Readiness Score.

    Factor 1: Employee Count (Weight: High)

    The math works better with more lives in the risk pool.

    Employees Self-Funding Viability Recommended Path
    Under 25 Low (too much volatility) PEO or Taft-Hartley multiemployer plan
    25 to 50 Moderate (with captive) Group captive or level-funded
    50 to 100 Good Level-funded or standalone self-funded
    100 to 200 Strong Standalone self-funded with stop-loss
    200+ Optimal Full self-funded, potentially with captive for stability

    According to the KFF 2025 Employer Health Benefits Survey, 27% of covered workers at firms with 10 to 199 employees are in self-funded plans, up from the prior year.¹ The trend is clear: smaller companies are moving toward self-funding, but they’re doing it through intermediate structures like level-funded plans and group captives.

    Factor 2: Claims History (Weight: Critical)

    You need data before you make this decision. Specifically, you need 24 months of claims data, ideally at a per-employee level (anonymized for privacy).

    Here’s the problem: if you’re fully insured, your carrier owns that data. Some carriers will share it, some won’t. If your carrier won’t provide claims data, that alone tells you something about the relationship.

    What you’re looking for:

    • Loss ratio: What percentage of your premiums went to claims? If it’s under 70%, you’re subsidizing the carrier’s profit margin.
    • High-cost claimants: Are there one or two individuals driving 60% to 80% of total claims? This is common and manageable with proper stop-loss structuring for high-cost claimants.
    • Claims trend: Are claims stable, rising, or declining year over year?

    Factor 3: Financial Stability (Weight: High)

    Self-funding requires cash flow management. Monthly contributions to the claims fund replace fixed premiums. In months with high claims, you pay more. In low-claims months, you pay less.

    Your company needs:

    • Sufficient cash reserves or credit facility to absorb monthly variance
    • Ability to budget for worst-case scenario (aggregate stop-loss corridor)
    • Willingness to accept short-term unpredictability for long-term savings

    Factor 4: Administrative Readiness (Weight: Moderate)

    Self-funded plans require more active management than fully insured:

    • You’ll need a TPA to handle claims processing
    • Someone (internally or externally) needs to manage the relationship
    • Compliance with ERISA reporting requirements
    • Annual plan document updates

    The good news: most TPAs and benefits consultants handle this. The administrative burden is real but manageable. Companies already using a PEO or sophisticated HRIS system typically transition smoothly.

    Factor 5: Risk Tolerance (Weight: Moderate)

    Some leadership teams genuinely prefer the predictability of fully insured, even at a premium. That’s a valid choice. Self-funding requires comfort with:

    • Monthly claims variance (some months will be higher than expected)
    • The discipline to maintain stop-loss coverage and not cut it to save money
    • Annual renewals on stop-loss that can vary based on claims experience
    Self-funding readiness score showing five key factors for employer health insurance transition
    Five factors that determine whether your company is ready for self-funded health coverage

    The Stepping Stone Strategy: You Don’t Have to Jump All at Once

    This is the part most brokers skip. They present self-funding as a binary choice: either you’re fully insured or you’re self-funded. In reality, there’s a spectrum of options between the two extremes.

    Level-Funded Plans (The Training Wheels)

    A level-funded plan gives you fixed monthly premiums like fully insured, but with self-funded economics underneath. If claims are low, you get a refund. If claims are high, the stop-loss kicks in.

    This is the lowest risk entry point. You get claims data transparency (which you need for the eventual full self-funded transition) without the monthly variability. Companies with 25 to 75 employees often start here.

    Group Captive (The Shared Pool)

    In a group captive, multiple companies pool their self-funded plans together. This creates a larger risk pool, which stabilizes costs. The captive typically comes with:

    • A savings guarantee
    • Shared stop-loss purchasing power
    • Claims data transparency
    • Potential dividend if the pool performs well

    Companies with 50 to 150 employees often find group captives hit the sweet spot between self-funding savings and fully insured stability.

    Taft-Hartley Multiemployer Trust

    A Taft-Hartley multiemployer health plan pools thousands of employees across hundreds of employers. The trust negotiates carrier rates, manages plan design, and spreads risk across the entire pool. Premium increases have averaged 3% or less for six consecutive years in some established trusts, compared to the 6% to 8% average for fully insured small group plans.¹

    This option works for companies as small as 5 enrolled employees and provides the cost stability of self-funding without any of the administrative complexity.

    📊 STRESS TEST YOUR RENEWAL

    Premium Renewal Stress Test at businessinsurance.health — model your renewal across five funding strategies over six years.

    No login required. No email gate. Free.

    Like this tool? We built five more just like it — all free, all ungated. Explore all tools at Business Insurance Health.

    The Hidden Math: What a Transition Actually Looks Like

    Let’s walk through a realistic scenario based on the types of transitions we model for clients.

    Model Employer: Mid-Size Company Outgrowing Fully Insured

    Parameter Value Source
    Industry Professional services Scenario
    Employees 150 (growing to 190) Scenario
    Current plan Fully insured PPO Scenario
    Current annual premium ~$2.2M Based on KFF avg $9,325 single × 150 × blended¹
    Recent renewal increase 19% Scenario based on market conditions
    Carrier loss ratio Unknown (carrier won’t share) Common scenario

    Year 1 Self-Funded Projection

    Component Fully Insured (Status Quo) Self-Funded (Year 1)
    Expected claims Included in premium $1.5M to $1.8M (estimated at 75% of premium)
    Stop-loss premium N/A $180,000 to $250,000
    TPA and admin fees Included $80,000 to $120,000
    Total expected cost $2,200,000 $1,760,000 to $2,170,000
    Potential savings $30,000 to $440,000
    Claims data access No Yes (monthly reporting)
    Surplus if claims are low Kept by carrier Kept by employer

    BIH model estimate. Savings range reflects variance between high-claims and low-claims scenarios. Stop-loss and admin fee ranges based on market rates for groups of 100 to 200 employees.

    The conservative end of that range might look underwhelming. That’s intentional. Year 1 of self-funding isn’t always about dramatic savings. It’s about getting claims data that lets you optimize Year 2 and beyond.

    By Year 3, companies with active claims management, pharmacy benefit carve-outs, and strategic plan design changes typically see 15% to 25% lower costs compared to where they would have been staying fully insured.³

    The Three Biggest Mistakes Companies Make When Switching

    Mistake 1: Switching Because of a Bad Renewal Without Data

    A 19% renewal increase feels like a reason to self-fund. But if your claims actually warrant that increase (meaning your loss ratio was over 100%), self-funding won’t magically reduce your claims. You’d be taking on the same risk the carrier is pricing for.

    Always get claims data first. If the carrier won’t share it, use the transition year to move to a level-funded plan that provides data, then make the self-funded decision with 12 months of actual claims information.

    Mistake 2: Underbuying Stop-Loss to Save Money

    Stop-loss is the safety net of self-funding. Setting the specific deductible too high ($200,000+ per individual) to save on premium can backfire catastrophically if multiple employees have serious claims in the same year. For companies under 200 employees, specific stop-loss deductibles of $50,000 to $125,000 provide the right balance of savings and protection.

    Mistake 3: Not Building a Multi-Year Plan

    The biggest advantage of self-funding isn’t Year 1 savings. It’s the compounding effect of claims data over time. Companies that build a three-year transition plan (level-funded → group captive → standalone self-funded) consistently outperform those that make a single leap.

    If you’re exploring health plan strategies for small manufacturers or any industry where turnover and workforce health matter, this phased approach is even more critical.

    When to Stay Fully Insured (It’s Not Always the Wrong Choice)

    Self-funding isn’t universally better. Stay fully insured if:

    • Your company has fewer than 25 employees and isn’t interested in a PEO or multiemployer trust
    • You have known high-cost claimants and don’t want the claims variance
    • Your leadership team values absolute predictability over potential savings
    • You’re in the middle of a major business transition (M&A, rapid hiring, relocation) and need stability
    • Your current carrier’s loss ratio is above 85% (meaning you’re getting good value)

    The worst outcome is switching to self-funded, having a bad claims year, panicking, and switching back to fully insured at an even higher rate. A thoughtful, data-driven transition prevents that scenario.

    You can project your costs across seven funding arrangements using the Health Funding Cost Projector at Business Insurance Health to see how each option plays out for your specific situation.

    Three year transition plan from fully insured to self-funded health insurance for employers
    A phased approach reduces risk while building toward full self-funding

    Frequently Asked Questions

    What size company should consider moving from fully insured to self-funded?

    Companies with 50 to 200 employees are in the strongest position for a direct transition to self-funded health coverage. Companies with 25 to 50 employees can access self-funding through group captives or level-funded plans. Below 25 employees, PEO arrangements or Taft-Hartley multiemployer trusts typically provide better economics. The KFF 2025 survey shows 27% of workers at firms with 10 to 199 employees are already in self-funded plans.¹

    How much can we save by switching from fully insured to self-funded?

    First-year savings typically range from 5% to 15% for companies with average or better-than-average claims experience. By Year 3, savings of 15% to 25% compared to the fully insured trajectory are common, driven by claims data optimization and plan design improvements. However, in a high-claims year, costs may be comparable to or slightly above fully insured. The key is stop-loss protection to cap downside risk.

    What happens if we have a catastrophic claim in the first year of self-funding?

    This is exactly what stop-loss coverage protects against. Specific stop-loss covers any individual claim above a set threshold (typically $50,000 to $150,000). Aggregate stop-loss caps your total annual claims liability. With properly structured stop-loss, your maximum annual exposure is defined before the plan year starts. You can stress test your renewal across five strategies to see how catastrophic claims affect each funding model.

    Can we keep our current carrier’s network if we move to self-funded?

    In most cases, yes. Major carriers like UHC, Aetna, Cigna, and Blue Cross Blue Shield all offer Administrative Services Only (ASO) arrangements where they provide the network and claims processing while the employer self-funds. You can often keep the same network your employees are accustomed to, eliminating the disruption of a carrier switch.

    What’s the difference between level-funded and self-funded?

    Level-funded plans fix your monthly cost like a fully insured plan but operate as self-funded underneath. If claims are low, you get a refund. If claims are high, stop-loss covers the overage. It’s essentially self-funded with training wheels. The main trade-off: level-funded plans are slightly more expensive than pure self-funded because the carrier charges for the guaranteed level payment structure. Read more in our guide to level-funded health coverage for small business.

    📊 MODEL YOUR FUNDING OPTIONS

    Health Funding Cost Projector at businessinsurance.health — compare seven funding arrangements side by side for your specific headcount and industry.

    No login required. No email gate. Free.

    Like this tool? We built five more just like it — all free, all ungated. Explore all tools at Business Insurance Health.

    References

    1. Kaiser Family Foundation. “2025 Employer Health Benefits Survey.” October 2025. https://www.kff.org/health-costs/2025-employer-health-benefits-survey/

    2. Self-Insurance Institute of America. “Self-Insured Health Plans: A Primer.” SIIA.org. https://www.siia.org/

    3. BIH model estimate based on client transition data across groups of 75 to 250 employees over 36 months. Savings reflect the difference between actual self-funded costs and projected fully insured renewal trajectory.

    4. Bureau of Labor Statistics. “Employer Costs for Employee Compensation.” Q2 2025. https://www.bls.gov/ecec/

    5. Managed Healthcare Executive. “The Leap to Self-Insurance.” March 2026. https://www.managedhealthcareexecutive.com/view/the-leap-to-self-insurance

    6. Roundstone Insurance. “Self-Funded Health Insurance: The Complete Guide.” December 2025. https://roundstoneinsurance.com/blog/how-self-funded-health-insurance-works/

    7. Marsh McLennan Agency. “Moving from Fully Insured to Self-Funded Insurance.” 2025. https://www.marshmma.com/us/insights/details/moving-from-fully-insured-to-self-funded.html

    8. KFF. “Annual Family Premiums for Employer Coverage Rise 6% in 2025, Nearing $27,000.” October 2025. https://www.kff.org/health-costs/annual-family-premiums-for-employer-coverage-rise-6-in-2025-nearing-27000/

    Methodology Note: Cost projections in this article use a blended approach combining KFF 2025 survey data for fully insured benchmarks and BIH client transition data for self-funded cost ranges. The “Model Employer” scenario uses a 75% expected claims-to-premium ratio based on industry averages for groups of 100 to 200 employees. Stop-loss and TPA fee ranges reflect 2025-2026 market rates. All savings projections are presented as ranges. Individual results depend on claims experience, plan design, stop-loss structure, and demographic mix.

    This analysis is provided for educational purposes and does not constitute financial or legal advice. Consult your compliance counsel and benefits advisor for guidance specific to your situation.

    About the Author

    Sam Newland, CFP® is the Founder and President of Business Insurance Health and PEO4YOU. With over 13 years in the employee benefits industry and experience as the former #1 face-to-face health benefits advisor nationally, Sam helps businesses with 30 to 200+ employees navigate funding strategies that most brokers don’t present. Contact: [email protected] | 857-255-9394 | businessinsurance.health | peo4you.com

  • ADP TotalSource Alternatives for Mid-Size Employers: 5 Options Beyond Enterprise PEO

    ADP TotalSource Alternatives for Mid-Size Employers: 5 Options Beyond Enterprise PEO

    You have 150-300 employees. You’ve been on ADP TotalSource for two or three years. The platform works, the payroll runs, but something feels off: your health insurance costs keep climbing, your dedicated HR contact changes every six months, and every benefit customization request disappears into a queue.

    You’re hitting what we call The Enterprise PEO Ceiling — the point where a large PEO’s standardized model stops fitting a mid-size employer’s specific needs. At Business Insurance Health and PEO4YOU, we work with employers navigating this exact transition. The answer isn’t always “leave your PEO.” Sometimes it’s “move to a different kind of PEO.” And sometimes the right move is off the PEO model entirely.

    In 2026, the employer health insurance market offers more alternatives than ever. The KFF 2024 survey found that average family premiums hit $26,993, up 6% year-over-year. For mid-size employers on ADP TotalSource, the question isn’t whether you can find a better deal — it’s which alternative fits your company’s trajectory.

    Key Takeaways
    • The “Enterprise PEO Ceiling”: ADP TotalSource and similar large PEOs optimize for scale, not customization — mid-size employers often outgrow the model before they outgrow the employee count.
    • Five alternatives to evaluate: dedicated-service PEOs, Taft-Hartley trusts, level-funded with standalone HR, broker-managed fully insured, and self-funded/captive arrangements.
    • At 150+ employees, most companies have enough scale to negotiate carrier rates directly, potentially eliminating the PEO admin premium.
    • The transition off ADP TotalSource typically takes 60-90 days with proper planning, including benefit continuity and employee communication strategies.
    • Key evaluation criteria: health plan flexibility, admin fee transparency, HR service quality, and total cost of ownership vs. current ADP spend.

    Why Mid-Size Employers Outgrow ADP TotalSource

    ADP TotalSource is the largest PEO in the United States, serving over 700,000 worksite employees. Its scale is both its strength and its limitation. Here’s what we consistently hear from mid-size employers at BIH:

    Health plan options are limited. ADP TotalSource offers a curated set of health plans from select carriers. For a 20-person company, that’s fine — access to any carrier network is an upgrade from small group rates. But a 200-person company can negotiate directly with UHC, Aetna, Cigna, and BCBS for custom plan designs. The PEO’s pre-built options become a constraint, not a benefit.

    Admin fees don’t decrease with scale. Whether you have 50 or 250 employees, the PEPM admin fee stays relatively flat. At 250 employees paying $120-$145 PEPM, that’s $360,000-$435,000/year in admin fees — more than enough to fund a dedicated HR team with broker-managed benefits.

    Service quality varies. Large PEOs rotate account managers and HR contacts. Every rotation means re-explaining your company’s culture, policies, and nuances. Dedicated-service PEOs and standalone brokers offer consistent personnel.

    Transparency gaps. Many employers on ADP TotalSource don’t know exactly what they’re paying for health insurance vs. admin vs. workers’ comp. The bundled billing model makes it harder to benchmark individual components. When we analyze ADP statements at BIH using the Benefits ROI Calculator, we frequently find 10-20% savings opportunities hidden in the bundled cost structure.

    The Enterprise PEO Ceiling showing where mid-size employers outgrow ADP TotalSource standardized model


    Five ADP TotalSource Alternatives for Mid-Size Employers

    Alternative Best For Savings Potential Trade-Off
    Dedicated PEO 100-200 EE wanting PEO benefits with better service 5-15% vs ADP Smaller provider, less tech
    Taft-Hartley Trust 30-200+ EE in qualifying industries 15-40% on health Benefits only — need separate HR/payroll
    Level-Funded + HR 50-150 EE with clean claims 10-30% + surplus More admin complexity
    Broker-Managed 150+ EE with HR capacity Varies widely Requires internal HR team
    Self-Funded/Captive 100+ EE with risk tolerance 15-35% long-term Claims volatility risk

    For employers evaluating option 2, see our Taft-Hartley health plan guide. For option 3, our level-funded insurance breakdown shows the math. For option 5, our captive insurance guide covers how employer-owned captives work.

    The Hidden Math: ADP TotalSource vs. Dedicated PEO for 265 Employees

    Here’s an anonymized comparison from a BIH client in the education/therapy sector with approximately 200-300 employees:

    Cost Component ADP TotalSource (Est.) Dedicated PEO Alternative
    Health insurance $1,800,000-$2,100,000 $1,500,000-$1,800,000
    Admin/PEPM fees $380,000-$435,000 $280,000-$340,000
    Workers’ comp Bundled (opaque) $190,000-$250,000 (itemized)
    Total estimated annual $2,800,000-$3,200,000 $2,200,000-$2,700,000
    Estimated annual savings $100,000-$500,000

    BIH model estimate based on anonymized client scenario. Range reflects uncertainty in ADP bundled cost allocation and variation in alternative provider quotes. Actual savings depend on claims experience, carrier negotiations, and service-level requirements.

    The key insight: even a modest 5-10% improvement in health insurance rates at this scale translates to $100,000-$200,000 — enough to fund dedicated HR staff while still saving money overall. Use the BIH Premium Renewal Stress Test to model how different funding strategies would perform over your specific renewal horizon.

    ADP TotalSource vs dedicated PEO cost comparison for 265 employees showing potential annual savings
    Model Your Own Total Cost Comparison
    Health Funding Cost Projector
    No login required. No email gate. Free.

    How to Transition Off ADP TotalSource: A 90-Day Roadmap

    Days 1-30: Analysis and Alternatives. Pull your complete cost data from ADP. Engage an independent broker (like BIH) to benchmark your health, comp, and admin costs against alternatives. Model scenarios using the Benefits Savings Strategy Builder.

    Days 30-60: Selection and Setup. Choose your alternative structure. If moving to a new PEO, initiate the co-employment transition. If moving to broker-managed, set up carrier contracts and hire or designate internal HR. Start employee communication.

    Days 60-90: Migration and Launch. Migrate payroll, transfer benefits enrollment, ensure COBRA compliance for departing plan members, and run parallel systems for one pay period to verify accuracy. Most transitions go smoothly with 60-90 days of lead time.

    90-day roadmap for transitioning off ADP TotalSource showing analysis selection and migration phases


    Frequently Asked Questions

    Is ADP TotalSource worth it for mid-size companies?

    For companies under 75 employees, ADP TotalSource often delivers strong value through pooled health insurance rates and integrated HR. For companies with 100-300+ employees, the value proposition weakens because you have enough scale to negotiate carrier rates directly and the admin fees become a significant line item — potentially $300,000-$435,000/year that could fund dedicated HR staff.

    How does ADP TotalSource compare to Paychex PEO and TriNet?

    All three are large-scale PEOs with similar strengths (technology, scale, carrier access) and similar limitations (standardized plan options, rotating account managers, opaque bundled billing). The differences tend to be in plan selection, geographic strength, and industry specialization. If your concern is the enterprise PEO model itself rather than ADP specifically, switching to Paychex or TriNet likely won’t resolve the underlying issues.

    Can I move to a Taft-Hartley plan from ADP TotalSource?

    Yes. Taft-Hartley multiemployer trusts are a health-benefits-only solution, so you’d need to arrange payroll and HR separately. But for employers where health insurance is the primary cost driver, Taft-Hartley savings of 15-40% can more than offset the cost of standalone payroll and HR. See our Taft-Hartley guide for eligibility details.

    What if I want to keep using a PEO but not ADP?

    Dedicated-service PEOs — smaller providers that specialize in specific industries or company sizes — often deliver better service at lower cost for mid-size employers. BIH and PEO4YOU can benchmark your current ADP costs against dedicated alternatives to show the cost and service difference.

    How long does it take to leave ADP TotalSource?

    Plan for 60-90 days from decision to complete migration. The critical path items are carrier contract setup (if moving off PEO health plans), payroll migration, and employee benefit enrollment in the new arrangement. Most ADP contracts require 30-60 days written notice.

    Model Your Own Renewal Strategy
    Premium Renewal Stress Test
    No login required. No email gate. Free.

    References

    1. Kaiser Family Foundation. “2024 Employer Health Benefits Survey.” October 2024. kff.org
    2. ADP. “Annual Report and Investor Overview.” 2025. investor.adp.com
    3. NAPEO. “PEO Industry Overview.” 2025. napeo.org
    4. Segal. “2026 Segal Health Plan Cost Trend Survey.” September 2025. segal.com
    5. SHRM. “Benchmarking HR Services: PEO vs. In-House.” 2024. shrm.org
    6. Bureau of Labor Statistics. “Employer Costs for Employee Compensation.” Q3 2025. bls.gov
    7. Mercer. “National Survey of Employer-Sponsored Health Plans.” 2024. mercer.com

    This analysis is provided for educational purposes and does not constitute financial or legal advice. Consult your compliance counsel and benefits advisor for guidance specific to your situation.


    About the Author: Sam Newland, CFP®, has spent 13+ years in the employee benefits industry and founded Business Insurance Health and PEO4YOU to bring transparency to an industry that profits from complexity. His approach is simple: show employers the real numbers and let them decide.

  • PEO for Growing Companies: Close the Benefits Gap

    PEO for Growing Companies: Close the Benefits Gap

    Six months ago, you had zero employees. Today you have 15. Next quarter you’re projecting 25. You’re running payroll on spreadsheets, your “benefits package” is a vague promise, and your top producer just asked about health insurance for the third time this week.

    This is what we call The Benefits Gap Trap: the window between when a company needs real benefits infrastructure and when it thinks it can afford it. At Business Insurance Health and PEO4YOU, we see this pattern constantly in companies scaling from 5 to 50 employees. The companies that close this gap early retain their best people. The ones that wait lose them to competitors who offer what you don’t.

    The data backs this up: 56% of employees say benefits are a major factor in whether they stay at a job, and the cost of replacing an employee ranges from 50–200% of their annual salary when you factor in recruiting, onboarding, and lost productivity. For a company growing fast, every departure is a setback multiplier.

    Key Takeaways
    • The “Benefits Gap Trap”: fast-growing companies lose key hires to competitors with better benefits packages during the 10–50 employee scaling phase.
    • PEOs give companies with as few as 5–10 employees access to Fortune 500-level health plans, 401(k), dental, vision, and life insurance from day one.
    • NAPEO data: PEO clients grow 7–9% faster and have 10–14% lower employee turnover than comparable businesses.
    • The transition from basic payroll to PEO typically takes 2–4 weeks and includes benefits enrollment, payroll migration, and compliance setup.
    • Cost: PEO admin fees add $40–$160 PEPM, but enterprise health insurance access often saves 15–35% vs. small group rates.

    The Benefits Gap Trap: Why Growing Companies Lose Top Talent

    Here’s the typical growth-stage timeline we see at PEO4YOU:

    Stage Typical Setup Risk
    1–5 employees Founder runs payroll manually or via basic tool Low — team knows the deal
    5–15 employees Basic payroll provider, no benefits Medium — top hires asking about insurance
    15–30 employees Maybe a small group plan, ad-hoc HR High — compliance risk, talent flight
    30–50 employees Scrambling to build HR infrastructure Critical — every departure hurts growth

    The Benefits Gap Trap hits hardest in the 10–30 employee range. You’re too big to run without benefits but feel too small to afford them. The math says otherwise.

    Benefits Gap Trap timeline showing risk levels at each company growth stage from 1 to 50 employees

    How a PEO Closes the Benefits Gap for Fast-Growing Companies

    A PEO solves the growth-stage benefits problem by giving small companies immediate access to benefits infrastructure that would otherwise require 100+ employees to assemble independently:

    Enterprise health insurance from day one. PEOs pool thousands of employees across client companies into a master health plan, giving your 15-person team access to the same UnitedHealthcare, Aetna, or BCBS PPO networks that a 5,000-person company uses. At PEO4YOU, we’ve seen PEO health rates come in 15–35% below small group fully insured rates for growing companies.

    Turnkey payroll and compliance. State tax registrations, new-hire reporting, ACA compliance, EEOC requirements, COBRA administration — these aren’t optional once you cross 5–50 employees, and mistakes are expensive. SHRM estimates that compliance failures cost small businesses $12,000–$43,000 per violation on average.

    401(k) and ancillary benefits. Dental, vision, life insurance, disability, and retirement plans are standard PEO offerings. For a growing company competing for talent against established firms, this package-level parity can be the difference between landing a key hire and losing them.

    Scalable HR support. When you grow from 15 to 40 employees in a year, your HR needs change weekly. PEOs provide dedicated HR representatives, employee handbooks, onboarding workflows, and termination guidance without requiring you to hire a full-time HR person.

    How a PEO provides enterprise benefits infrastructure for fast-growing small companies

    The Hidden Math: Cost of Not Having Benefits vs. PEO Investment

    The Turnover Cost Multiplier

    Let’s model the cost of losing employees because you don’t offer competitive benefits:

    Parameter Value
    Employees 20 (growing to 35)
    Avg salary $65,000–$85,000
    Turnover without benefits 25–35% annually (BLS JOLTS avg for small firms)
    Turnover with PEO benefits 15–25% (10–14% reduction per NAPEO)
    Replacement cost per employee 50–200% of salary (SHRM)

    At 25 employees with $75,000 average salary and 30% turnover, you’re losing ~7–8 employees per year. Replacement cost at 75% of salary: $393,750–$450,000 annually in turnover costs. Reducing turnover by 10–14 percentage points saves $131,000–$210,000/year — far exceeding the PEO admin fee of $36,000–$48,000.

    BIH model estimate combining SHRM replacement cost data with NAPEO turnover reduction benchmarks. Actual turnover varies by industry, geography, and company culture.

    Model Your Own Benefits ROI
    Benefits ROI Calculator at Business Insurance Health
    No login required. No email gate. Free.

    When to Make the PEO Transition: Timing the Switch

    Based on our experience at BIH and PEO4YOU, the optimal PEO entry points are:

    Before your first key hire asks about benefits. If a critical employee is asking about health insurance, you’re already behind. The PEO enrollment process takes 2–4 weeks from contract signing to live benefits.

    Before you cross compliance thresholds. At 50 employees, ACA employer mandate kicks in. At 15, EEOC requirements begin. At 20, COBRA obligations start in many states. PEOs handle these transitions automatically.

    During a funding or revenue milestone. Just closed a round or landed a major contract? That’s the moment to invest in benefits infrastructure. The cost is marginal relative to the capital deployed, and the talent retention impact is immediate.

    For a detailed cost comparison between PEO models and standalone alternatives, see our PEO cost analysis breakdown. And for employers already considering PEO alternatives, our guide to ADP TotalSource alternatives compares the major providers.

    PEO transition timeline for growing companies showing 2 to 4 week onboarding process

    Frequently Asked Questions About PEOs for Growing Companies

    How many employees do I need to join a PEO?

    Most PEOs accept companies with as few as 5–10 employees, though pricing and plan options improve as you scale. The sweet spot for PEO value is typically 15–100 employees, where you’re large enough to benefit from pooled rates but too small to justify building benefits infrastructure in-house.

    Can I keep my PEO benefits if my company grows past 100 employees?

    Yes, but you should re-evaluate the math at 75–100+ employees. At this scale, your company may qualify for direct carrier negotiation, level-funded plans, or Taft-Hartley trusts that offer comparable or better rates without the PEO admin premium.

    How quickly can a PEO set up benefits for my team?

    Typical onboarding takes 2–4 weeks from contract signing. This includes payroll migration, benefits enrollment, compliance documentation, and employee communications. Some PEOs offer expedited 1-week setups for urgent situations.

    Will my employees know we use a PEO?

    Yes — the PEO will appear as the employer of record on W-2s and some benefits cards. Most employees don’t mind; they care about the quality of coverage and the benefits available to them, not the administrative structure behind it.

    Is a PEO better than hiring an HR person for a growing company?

    A full-time HR generalist costs $55,000–$85,000/year plus benefits. A PEO for 25 employees costs $36,000–$48,000/year in admin fees and includes HR support, compliance, benefits administration, and payroll. For companies under 50 employees, the PEO typically provides more comprehensive HR coverage at a lower total cost. Above 50, the calculus shifts toward in-house HR combined with standalone benefits.

    Model Your Own Business Valuation Impact
    Business Valuation Tool at Business Insurance Health
    No login required. No email gate. Free.

    References

    1. SHRM. “Employee Benefits Survey: Impact on Retention.” 2024. shrm.org
    2. SHRM. “The Real Costs of Recruitment.” 2024. shrm.org/topics-tools/news/talent-acquisition
    3. SHRM. “Compliance Costs for Small Businesses.” 2024. shrm.org
    4. Bureau of Labor Statistics. “JOLTS: Job Openings and Labor Turnover Survey.” Q4 2025. bls.gov/jlt/
    5. NAPEO/McBassi & Company. “PEO Industry White Paper: Growth and Turnover Impact.” 2024. napeo.org
    6. Kaiser Family Foundation. “2024 Employer Health Benefits Survey.” October 2024. kff.org
    7. U.S. Chamber of Commerce. “Small Business Benefits and Workforce Report.” 2025. uschamber.com

    This analysis is provided for educational purposes and does not constitute financial or legal advice. Consult your compliance counsel and benefits advisor for guidance specific to your situation.


    About the Author: Sam Newland, CFP®, has spent 13+ years in the employee benefits industry and founded Business Insurance Health and PEO4YOU to bring transparency to an industry that profits from complexity. His approach is simple: show employers the real numbers and let them decide.

  • PEO Cost Analysis: Does the Math Actually Work?

    PEO Cost Analysis: Does the Math Actually Work?

    You’ve heard the pitch: bundle your HR, payroll, health insurance, and workers’ comp with a PEO and save money. The question nobody answers clearly is how much does a PEO actually cost, and does the math work for your company?

    PEO fees typically range from $40–$160 per employee per month (PEPM) or 2–6% of gross payroll, depending on the provider, services included, and your company’s risk profile. But quoting the fee in isolation is like quoting a health insurance premium without mentioning the deductible — it’s the total cost of ownership that matters.

    At Business Insurance Health and PEO4YOU, we’ve analyzed PEO cost structures for hundreds of employers. The honest answer: PEOs save some companies 15–40% on total benefits-related costs, and cost other companies 10–20% more than they need to spend. The difference comes down to what we call The PEO Break-Even Equation.

    Key Takeaways
    • PEO fees range from $40–$160 PEPM or 2–6% of payroll, but the fee is only one component of total cost.
    • The PEO Break-Even Equation: PEO savings exceed PEO costs when health insurance discount + workers’ comp savings + avoided HR costs > PEO admin premium over standalone alternatives.
    • Construction and high-risk industries often see the strongest PEO ROI due to workers’ comp rate advantages of 20–50%.
    • NAPEO data shows PEO clients grow 7–9% faster and have 10–14% lower turnover than comparable non-PEO businesses.
    • The hidden cost: PEO admin fees of $42,000–$52,000/year for a 30-employee company vs. $8,000–$12,000 for standalone payroll processing.

    What Does a PEO Actually Cost? The Full Fee Breakdown

    PEO pricing falls into two models:

    Model How It Works Typical Range
    Flat PEPM Fixed dollar amount per employee per month $40–$160/employee/month
    % of Payroll Percentage of total gross payroll 2–6% of gross payroll

    But the fee label is misleading. What’s included in the fee varies enormously across providers. Some PEOs bundle health insurance, workers’ comp, payroll, HR support, and compliance into a single PEPM. Others quote a base admin fee and layer health insurance, workers’ comp, and compliance as separate line items.

    PEO pricing model comparison showing flat PEPM versus percentage of payroll fee structures


    The PEO Break-Even Equation: A Cost Waterfall for a 30-Employee Construction Company

    Let’s model this with a real (anonymized) scenario from our PEO4YOU practice.

    Model Employer Parameters

    Parameter Value & Source
    Industry Construction (generalized)
    Headcount 25–35 employees
    Avg. annual salary $55,000–$65,000 (BLS ECEC construction avg)
    Workers’ comp rate (standalone) $8–$14 per $100 payroll (construction avg)
    Current health insurance Fully insured, $8,500–$10,000/employee/year (KFF 2024)
    Current payroll processing $8,000–$12,000/year standalone

    Cost Waterfall: PEO vs. Standalone for 30 Employees

    Cost Category Standalone PEO
    Health insurance $255,000–$300,000 $165,000–$195,000
    Workers’ comp $132,000–$231,000 $82,500–$150,000
    Payroll processing $8,000–$12,000 Included in PEO fee
    HR/compliance support $0 (DIY) or $15,000–$30,000 (outsourced) Included in PEO fee
    PEO admin fee N/A $42,000–$52,000 ($120–$145 PEPM)
    TOTAL ANNUAL COST $395,000–$573,000 $289,500–$397,000

    Net savings range: $105,500–$176,000/year (27–31% reduction). BIH model estimate based on anonymized construction client scenario with PEO health insurance rates 35–52% below fully insured and workers’ comp rates 20–45% below standalone.

    BIH model estimate. Actual savings vary by PEO provider, claims history, workers’ comp classification codes, and geographic location. Health savings reflect PEO master plan pooling advantage; workers’ comp savings reflect PEO experience modification rate.

    But notice the PEO admin fee of $42,000–$52,000. Compare that to standalone payroll at $8,000–$12,000. The PEO charges $30,000–$40,000 more in admin fees than basic payroll. The math only works because the health and workers’ comp savings significantly exceed this premium.

    PEO cost waterfall comparison showing standalone versus PEO total annual costs for 30-employee construction company
    Model Your Own PEO ROI
    Benefits ROI Calculator at Business Insurance Health
    No login required. No email gate. Free.

    When the PEO Math Doesn’t Work

    Not every employer benefits from a PEO. Based on our analysis at BIH, the math typically breaks down when:

    Your health claims are already low. If you’re a healthy workforce on a level-funded plan earning surplus refunds, the PEO’s pooled rate may actually cost more than your current arrangement.

    Your workers’ comp risk is low. Office-based employers with low workers’ comp rates ($0.50–$2.00 per $100 payroll) don’t get the dramatic comp savings that make PEOs compelling for construction and manufacturing.

    You’re above 150 employees. At this scale, you likely have enough leverage to negotiate carrier rates independently and justify dedicated HR staff. PEO admin fees become harder to justify when you can replicate the value in-house. Consider ADP TotalSource alternatives or standalone broker-managed programs.

    You need maximum flexibility. PEO co-employment means shared employment records, standardized benefit plans, and carrier restrictions. If you need highly customized benefits or want to switch carriers mid-year, the PEO model creates friction.

    NAPEO reports that PEO clients grow 7–9% faster and are 50% less likely to go out of business than comparable non-PEO companies, but these aggregate statistics include selection bias — companies that proactively manage their benefits tend to be better-run businesses overall.

    Choosing Between PEO Models: Bundled vs. Flat-Fee vs. Percentage-Based

    Not all PEOs are structured the same. The three primary models affect cost transparency:

    PEO Type Pros Cons
    Bundled (all-in) Simple billing, one vendor Hard to isolate where money goes
    Flat-fee admin Transparent admin cost, insurance separate Must compare insurance rates independently
    % of payroll Scales with workforce size Penalizes higher-salary workforces

    At PEO4YOU, we generally recommend flat-fee admin PEOs for cost-conscious employers because they provide the clearest view of what you’re paying for. When health insurance is quoted separately, you can benchmark it against Taft-Hartley trust rates and level-funded options.

    Comparison of bundled all-in versus flat-fee versus percentage-based PEO pricing models


    Frequently Asked Questions About PEO Costs

    How much does a PEO cost per employee per month?

    PEO fees typically range from $40–$160 per employee per month for admin services, or 2–6% of gross payroll. Health insurance and workers’ comp are usually additional. Total cost depends on services included, industry risk classification, and company size. Use the BIH Benefits ROI Calculator to model your total cost of ownership.

    Is a PEO cheaper than buying health insurance directly?

    For many small businesses with 15–100 employees, PEO health insurance rates are 15–40% below small group fully insured rates because PEOs pool thousands of employees into a master plan. However, if your company has below-average claims and qualifies for level-funded or Taft-Hartley plans, those strategies may deliver comparable or greater savings without the PEO admin fee.

    What’s the difference between PEO admin fees and payroll company fees?

    A standalone payroll company (ADP Run, Gusto, Paychex Flex) costs $8,000–$15,000/year for a 30-employee company. A PEO admin fee for the same company runs $42,000–$52,000/year. The $30,000–$40,000 difference pays for HR compliance support, benefits administration, risk management, and co-employment protections. Whether that’s worth it depends on your internal HR capacity.

    What industries get the best PEO ROI?

    Construction, manufacturing, staffing, and other high-risk industries see the strongest PEO ROI because workers’ comp rate reductions of 20–50% often represent the largest single line-item savings. Low-risk office environments benefit less on the comp side but may still gain from PEO health insurance pooling.

    When should I leave a PEO?

    Consider transitioning off a PEO when your company exceeds 100–150 employees and can negotiate carrier rates independently, when your claims experience qualifies for level-funded or self-funded plans, or when the PEO’s benefit plan options no longer match your workforce needs. For a detailed framework, see our PEO4YOU guide on evaluating your PEO.

    Model Your Own Total Cost of Ownership
    Benefits ROI Calculator at Business Insurance Health
    No login required. No email gate. Free.

    References

    1. NAPEO. “PEO Industry Overview: Fee Ranges and Service Models.” 2025. napeo.org
    2. Bureau of Labor Statistics. “Employer Costs for Employee Compensation: Construction.” Q3 2025. bls.gov/news.release/ecec.toc.htm
    3. NCCI. “State of the Line: Workers’ Compensation Rate Trends.” 2025. ncci.com
    4. Kaiser Family Foundation. “2024 Employer Health Benefits Survey.” October 2024. kff.org
    5. NAPEO/McBassi & Company. “PEO Industry White Paper: Business Impact.” 2024. napeo.org
    6. SHRM. “Outsourcing HR: PEO vs. ASO vs. In-House.” 2024. shrm.org
    7. U.S. Small Business Administration. “Employer Costs and Benefits Benchmarks.” 2025. sba.gov

    This analysis is provided for educational purposes and does not constitute financial or legal advice. Consult your compliance counsel and benefits advisor for guidance specific to your situation.


    About the Author: Sam Newland, CFP®, has spent 13+ years in the employee benefits industry and founded Business Insurance Health and PEO4YOU to bring transparency to an industry that profits from complexity. His approach is simple: show employers the real numbers and let them decide.

  • Taft-Hartley Health Plans

    Taft-Hartley Health Plans

    Your broker just presented three options for next year’s health insurance: the same carrier at a higher rate, a different carrier at a slightly lower rate, or a higher-deductible plan to offset the increase. Sound about right?

    There’s a fourth option that 95% of brokers never present: a Taft-Hartley multiemployer health plan. It’s not new — these plans have existed since the Taft-Hartley Act of 1947 — but most brokers either don’t understand them or don’t have access to them. We call this The Broker Blind Spot, and it costs small employers hundreds of thousands of dollars over time.

    At Business Insurance Health and PEO4YOU, we’ve helped employers with 30-200+ employees access Taft-Hartley trusts that delivered 15-40% savings compared to their fully insured plans — with BCBS PPO networks, no reduction in plan quality, and multi-year rate stability that fully insured carriers simply cannot match.

    Key Takeaways
    • Taft-Hartley multiemployer health plans pool multiple employers into a single trust, leveraging group purchasing power and shared risk to negotiate below-market rates.
    • Small businesses with 30-200+ employees can access these plans through management-side organizations (MSOs) — you don’t need to be unionized.
    • Projected savings range from 15-40% vs. fully insured, with multi-year rate stability that eliminates annual renewal shock.
    • The “Broker Blind Spot”: most brokers don’t present Taft-Hartley because they lack access or understanding, not because it’s a poor fit.
    • Fiduciary oversight by independent trustees means the plan operates in members’ best interests — not carrier profit interests.

    What Is a Taft-Hartley Multiemployer Health Plan?

    A Taft-Hartley health plan — also called a multiemployer health and welfare fund — is a trust-based health benefits arrangement where multiple employers contribute to a shared fund administered by a joint board of trustees. The trust negotiates directly with carriers and providers, pooling the purchasing power of all participating employers.

    Unlike fully insured plans where each employer is rated independently, Taft-Hartley trusts aggregate risk across dozens or hundreds of employers. This pooling effect smooths out the impact of individual high-cost claims and gives the trust leverage that no single small employer could achieve alone.

    The key structural components:

    Component How It Works Employer Impact
    Trust Fund Pooled contributions from all employers Shared risk = rate stability
    Board of Trustees Joint labor-management oversight (ERISA fiduciary) Operates for members, not carrier profit
    Carrier Access Trust negotiates directly with major carriers BCBS, UHC, Aetna PPO networks available
    Contribution Rate Fixed per-employee-per-month contribution Predictable budgeting, multi-year stability
    MSO Structure Management-side organization facilitates non-union access No union required for participation

    The critical misconception: you don’t need to be a union shop. Through a management-side organization (MSO) structure, non-union employers can participate in Taft-Hartley trusts while maintaining their existing employment relationships.

    Taft-Hartley multiemployer health plan structure for small businesses

    The Broker Blind Spot: Why Most Advisors Skip Taft-Hartley Plans

    In 13+ years in the employee benefits industry, I’ve watched the same pattern repeat: a broker presents fully insured options, maybe adds a level-funded alternative, and calls it a day. Taft-Hartley never enters the conversation.

    This isn’t malice — it’s structural. Most brokers don’t present Taft-Hartley for three reasons:

    1. Access barriers. Taft-Hartley trusts don’t work through standard broker distribution channels. They require specialized relationships with trust administrators and MSO partners. If your broker doesn’t already have these relationships, the option simply doesn’t exist in their toolkit.

    2. Commission structure. Many Taft-Hartley trusts use flat administrative fees rather than percentage-based broker commissions. This changes the economics for the advisor — not necessarily for the better. A broker earning 4-5% on a fully insured plan has limited financial incentive to move you to a flat-fee trust arrangement.

    3. Complexity perception. The words “Taft-Hartley” and “multiemployer” trigger associations with large union plans, pension obligations, and regulatory complexity. The reality is simpler: for a participating employer, the experience is comparable to a fully insured plan — you pay a fixed monthly contribution and your employees access a carrier network.

    This blind spot means thousands of eligible small businesses are overpaying for health coverage by 15-40% annually. When we run the numbers using the BIH Health Funding Cost Projector, the gap is often the largest single savings opportunity available.

    The Hidden Math: Taft-Hartley vs. Fully Insured for a 30-40 Employee Company

    Let’s model this with a real (anonymized) scenario from our client work.

    Model Employer Parameters

    Parameter Value & Source
    Industry Healthcare services (generalized)
    Headcount 30-40 employees
    Structure MSO with multiple related entities
    Current funding Fully insured BCBS PPO
    Current annual cost $380,000-$420,000 (BIH client analysis)
    Annual renewal trend 8-12% (Segal/PwC 2026 projections)

    6-Year Cost Comparison: Fully Insured vs. Taft-Hartley Trust

    Year Fully Insured (10% renewal) Taft-Hartley Trust Annual Savings
    1 $400,000 $260,000-$320,000 $80,000-$140,000
    2 $440,000 $268,000-$330,000 $110,000-$172,000
    3 $484,000 $276,000-$340,000 $144,000-$208,000
    4 $532,000 $284,000-$350,000 $182,000-$248,000
    5 $585,000 $292,000-$360,000 $225,000-$293,000
    6 $644,000 $301,000-$371,000 $273,000-$343,000

    Projected 6-year cumulative savings: $600,000-$1,400,000 (BIH model estimate). The range depends on trust contribution rates, fully insured renewal trajectory, and claims experience. Conservative estimate assumes 3% annual trust contribution increases; aggressive assumes flat trust rates for years 1-3.

    BIH model estimate based on anonymized client scenario. Trust contribution rates derived from actual MSO participation data. Fully insured projections based on 10% compound annual renewal, consistent with 2024-2026 small group median trends.

    Model Your Own Savings Across Funding Strategies
    Health Funding Cost Projector
    No login required. No email gate. Free.

    Who Qualifies for Taft-Hartley Multiemployer Health Plans?

    Eligibility varies by trust, but the general parameters at BIH and PEO4YOU include:

    Minimum group size: Most trusts require 25-30+ eligible employees, though some MSO structures allow smaller groups by combining related entities (e.g., a management company with 15 employees and a services company with 20).

    Industry alignment: Some trusts are industry-specific (construction, healthcare, hospitality), while others are open to multiple industries. The trust’s risk profile works best when participating employers share similar workforce demographics.

    Geographic availability: Taft-Hartley trusts operate regionally. Coverage depends on the carrier networks the trust has negotiated. In the Northeast (NY, MA, CT), several trusts offer BCBS and UHC PPO access.

    Commitment period: Most trusts require a 12-month minimum participation, with some offering multi-year rate locks that further enhance cost predictability.

    For employers comparing Taft-Hartley to other alternatives, the BIH Benefits Savings Strategy Builder models 32+ strategies including level-funded, PEO, and captive arrangements to identify the optimal fit.

    Risks and Limitations of Taft-Hartley Health Plans

    ERISA fiduciary requirements. As a multiemployer plan, Taft-Hartley trusts are subject to ERISA fiduciary standards. Trustees must act in the best interests of plan participants. This is actually a benefit for participating employers — it means the plan can’t make decisions that favor the carrier over members — but it adds regulatory complexity.

    Limited portability. If you leave the trust, your employees transition to whatever coverage you arrange next. There’s no continuity guarantee. Plan the exit strategy before you enter.

    Contribution rate increases. Trust contribution rates can increase, though typically at 2-5% annually — significantly below the 8-12% fully insured median. However, in years with adverse trust-wide claims experience, increases can be higher.

    Withdrawal liability. Some trusts assess withdrawal liability if an employer exits before a specified period. Understand the terms before committing. This is where having an advisor experienced with multiemployer plan structures matters.

    Frequently Asked Questions

    Do I need to be a union employer to access a Taft-Hartley health plan?

    No. Through a management-side organization (MSO) structure, non-union employers can participate in Taft-Hartley trusts. The MSO acts as the collective bargaining agent, and your employment relationships remain unchanged. This is one of the most common misconceptions that keeps eligible employers from exploring this option.

    How much can my small business save with a Taft-Hartley multiemployer plan?

    Based on BIH client analysis, employers with 30-200+ employees typically see 15-40% savings compared to fully insured rates, depending on the trust’s negotiated carrier rates and the employer’s current cost baseline. Use the BIH Benefits ROI Calculator to model your specific scenario.

    What carriers and networks are available through Taft-Hartley trusts?

    Major carrier networks including BCBS, UnitedHealthcare, Aetna, and Cigna are commonly available through established trusts. The specific network depends on the trust’s geographic footprint and negotiated contracts. Plan quality — including PPO access, prescription coverage, and preventive care — is typically comparable to or better than small group fully insured products.

    How does a Taft-Hartley plan compare to a PEO for health insurance?

    PEOs bundle health insurance with HR administration, payroll, and workers’ comp into a single co-employment model. Taft-Hartley plans are health-benefits-only — you keep your existing payroll, HR, and comp arrangements. For employers who only need benefits savings (not full HR outsourcing), Taft-Hartley often delivers deeper savings. For those wanting bundled services, see our PEO cost analysis.

    What happens if I want to leave the Taft-Hartley trust?

    Exit terms vary by trust. Some allow departure at the end of any plan year with 60-90 days notice. Others may assess a withdrawal contribution for employers leaving within the first 2-3 years. Always negotiate exit terms upfront and document them in writing before joining.

    Model Your Own Benefits Savings
    Benefits Savings Strategy Builder
    No login required. No email gate. Free.

    References

    1. U.S. Department of Labor. “Multiemployer Health Plans Under ERISA.” 2025. dol.gov
    2. IFEBP (International Foundation of Employee Benefit Plans). “Multiemployer Health & Welfare Fund Survey.” 2024. ifebp.org
    3. Segal. “2026 Segal Health Plan Cost Trend Survey.” September 2025. segal.com
    4. PwC Health Research Institute. “Medical Cost Trend: Behind the Numbers 2026.” June 2025. pwc.com
    5. U.S. Department of Labor. “ERISA Fiduciary Requirements for Multiemployer Plans.” 2025. dol.gov
    6. Kaiser Family Foundation. “2024 Employer Health Benefits Survey.” October 2024. kff.org
    7. Business Group on Health. “2026 Large Employer Health Care Strategy Survey.” 2025. businessgrouphealth.org
    8. SHRM. “Multiemployer Plan Participation: Employer Guide.” 2024. shrm.org

    This analysis is provided for educational purposes and does not constitute financial or legal advice. Consult your compliance counsel and benefits advisor for guidance specific to your situation.


    About the Author: Sam Newland, CFP®, has spent 13+ years in the employee benefits industry and founded Business Insurance Health and PEO4YOU to bring transparency to an industry that profits from complexity. His approach is simple: show employers the real numbers and let them decide.

  • Level-Funded Health Insurance for Small Business

    Level-Funded Health Insurance for Small Business

    Your renewal letter just arrived. It says 18%. Maybe 22%. You’re running a 25-50 employee company, your claims were clean last year, and the carrier is still raising your rates by double digits. Sound familiar?

    You’re not alone. The median small group health insurance renewal increase for 2026 is projected at 8-12%, with many employers in the 15-25% range depending on geography and claims history. Fully insured premiums have increased by an average of 6-7% annually over the past five years, compounding into a cost trajectory that quietly crushes small business margins.

    But here’s what most brokers won’t tell you: level-funded health insurance gives small businesses access to the same cost-containment mechanics that large employers have used for decades — claims transparency, surplus refunds, and experience-based pricing — without the downside risk of full self-funding.

    In our experience analyzing hundreds of renewals at Business Insurance Health and PEO4YOU, we’ve found that employers with 25-75 employees and relatively healthy workforces can save 10-30% in the first year by making this switch. Here’s exactly how the math works.

    Key Takeaways
    • Level-funded plans combine the predictability of fully insured premiums with the savings potential of self-funding, including surplus refunds when claims come in under budget.
    • Small businesses with 25-75 employees and below-average claims experience are the sweet spot for level-funded savings of 10-30%.
    • The “Renewal Ratchet Effect” means fully insured employers lose 18-40% to compounding rate increases over 6 years — even with flat claims.
    • Level-funded plans are regulated differently than traditional self-funded ERISA plans — stop-loss coverage caps your downside risk.
    • Carriers like Aetna, UnitedHealthcare, Cigna, and Anthem now offer competitive small group level-funded products nationwide.

    What Is Level-Funded Health Insurance for Small Business?

    Level-funded health insurance is a funding arrangement where the employer pays a fixed monthly amount — similar to a fully insured premium — but the dollars flow into three distinct buckets: a claims fund, an administrative fee, and stop-loss insurance.

    Here’s how the three components break down:

    Component What It Covers Typical % of Total
    Claims Fund Pays employee medical claims directly 60-70%
    Admin Fee Network access, claims processing, compliance 15-20%
    Stop-Loss Premium Specific (per-person) + aggregate (total) protection 15-25%

    The critical difference from fully insured: if your employees’ claims come in under the funded amount, you get the surplus back. In a fully insured plan, the carrier keeps 100% of the difference between what you paid and what they spent on your claims.

    This is why level-funded adoption has surged. According to industry data, the share of small and mid-size employers using level-funded arrangements grew from approximately 13% in 2020 to over 40% by 2023, and the trend has continued through 2025-2026. Employers are tired of subsidizing other companies’ claims in fully insured risk pools.

    Level-funded health plan structure showing claims fund stop-loss and admin components

    The Renewal Ratchet Effect: How Fully Insured Plans Quietly Compound Against You

    Here’s a pattern we see constantly at BIH and PEO4YOU: an employer with clean claims gets hit with a renewal increase. They shop carriers. The new carrier offers a marginally better rate. Two years later, the same cycle repeats. Over six years, the compounding effect is devastating.

    We call this The Renewal Ratchet Effect — and it’s the hidden tax on every fully insured small employer in America.

    Model Employer: The Renewal Ratchet in Action

    Parameter Value & Source
    Industry Professional services (generalized)
    Headcount 25-50 employees
    Avg. annual health cost/employee $7,400-$8,400 (single); $22,000-$27,000 (family) — KFF 2024
    Funding strategy (current) Fully insured
    Annual renewal trend 8-12% median (Segal/PwC 2026 projections)
    Claims experience Below average (clean year)

    When we modeled this scenario using the BIH Premium Renewal Stress Test, the 6-year cost trajectory was stark:

    6-Year Fully Insured Cost Projection (Compounding at 10% Annual Renewal)

    Year Monthly Premium (35 EE) Annual Cost Cumulative Overpayment vs. Flat
    1 $29,200 $350,400
    2 $32,120 $385,440 $35,040
    3 $35,332 $423,984 $108,624
    4 $38,865 $466,380 $224,604
    5 $42,752 $513,024 $387,228
    6 $47,027 $564,324 $601,152

    That’s over $600,000 in cumulative excess cost over six years for a 35-person company — money that went to the carrier, not to the business. BIH model estimate based on 10% compound renewal, consistent with 2024-2026 small group median trends.

    A level-funded employer with the same clean claims history would have seen 3-5 of those 6 years end with a surplus refund, effectively resetting the ratchet. That’s the fundamental asymmetry: fully insured plans only ratchet up, while level-funded plans can ratchet back.

    How fully insured renewal increases compound over 6 years for small businesses

    Which Small Businesses Benefit Most from Level-Funded Health Insurance?

    Level-funded isn’t a fit for every employer. In our analysis across hundreds of transitions at BIH, the strongest candidates share these characteristics:

    Sweet spot: 25-75 employees with a workforce that skews younger or has below-average claims utilization. Employers above 75 often have enough scale to explore full self-funding or captive arrangements. Employers below 20 may not have enough lives to generate meaningful claims data for experience rating.

    Industry fit: Professional services, technology, financial services, and any industry with a predominantly desk-based workforce tend to see the strongest level-funded results. But we’ve also seen construction and manufacturing employers succeed by combining level-funded plans with wellness programs and reference-based pricing networks.

    Claims history: Employers with one or more years of clean claims data — no high-cost claimants above the specific stop-loss threshold — are positioned for immediate savings. If you’re coming off a bad claims year, a level-funded plan may still work, but the stop-loss premium will be higher, reducing the savings margin.

    When we compared funding strategies using the BIH Health Funding Cost Projector, level-funded consistently outperformed fully insured by 10-20% for employers in this sweet spot, with upside potential of 25-30% in surplus-refund years.

    The Hidden Math: Level-Funded vs. Fully Insured for a 35-Employee Company

    Let’s break down the actual cost components side by side. This is the transparency that most brokers skip — they quote you a fully insured rate and a level-funded rate without showing where the dollars go.

    Cost Component Fully Insured Level-Funded
    Claims cost (estimated) Hidden in premium $245,000-$265,000
    Admin/network fee Hidden in premium $52,500-$70,000
    Stop-loss premium N/A (carrier retains risk) $52,500-$87,500
    Carrier profit/risk margin 12-18% of premium Included in admin fee
    Total annual cost $350,000-$380,000 $350,000-$370,000 (max)
    Surplus refund potential $0 (carrier keeps surplus) $35,000-$70,000 (if claims low)
    Effective net cost (good year) $350,000-$380,000 $280,000-$335,000

    BIH model estimate based on anonymized client scenario: 35-employee professional services company, below-average claims, transitioning from fully insured to level-funded with Aetna PPO network access. Actual results vary by demographics, claims history, and stop-loss terms.

    The key insight: even in the worst-case scenario, the level-funded cost is comparable to fully insured. But in a good claims year, the employer recaptures $35,000-$70,000 that would have been carrier profit under the old plan. Over three years, that’s $100,000-$210,000 in potential savings for a mid-size employer.

    Level-funded vs fully insured health insurance savings for 30-employee company
    Model Your Own Renewal Scenarios
    Premium Renewal Stress Test
    No login required. No email gate. Free.

    What to Watch for: Level-Funded Plan Risks and Limitations

    Level-funded isn’t risk-free. Here’s what we advise every employer to evaluate before making the switch:

    Stop-loss thresholds matter enormously. The specific stop-loss deductible — the per-person claims threshold before the reinsurer steps in — typically ranges from $25,000 to $75,000 for small groups. A lower deductible means more protection but a higher stop-loss premium. Get this wrong and your “savings” disappear into stop-loss costs.

    Disclosure requirements vary by state. Some states regulate level-funded plans as insurance products (subject to state mandates and community rating), while others classify them as self-funded ERISA plans with federal-only regulation. This affects everything from benefit mandates to rate-setting flexibility. The DOL’s ERISA framework governs fiduciary responsibility for self-funded arrangements.

    Renewal isn’t guaranteed. Unlike fully insured plans where carriers must renew (with a rate increase), level-funded carriers can decline to renew groups with adverse claims experience. If you have a catastrophic claims year, your renewal options may narrow.

    For employers weighing level-funded against other alternatives, we also recommend exploring Taft-Hartley multiemployer plans — a strategy that 95% of brokers never mention — and PEO-based health coverage for groups that want bundled administration.

    How to Transition from Fully Insured to Level-Funded Health Insurance

    Based on our experience managing these transitions at BIH, here’s the process that produces the best outcomes:

    1. Pull your claims data. Request a detailed claims report from your current carrier (you’re entitled to this under most contracts). You need 12-24 months of claims data broken out by category: inpatient, outpatient, pharmacy, and high-cost claimants above $25,000.

    2. Model the scenarios. Run your data through a funding comparison tool that shows fully insured vs. level-funded vs. other strategies side by side with confidence intervals — not just best-case projections.

    3. Evaluate carrier options. Carriers like UnitedHealthcare, Aetna, Cigna, and Anthem offer competitive level-funded products for small groups. Compare network breadth, stop-loss terms, and admin fees — not just the headline rate.

    4. Integrate with an HRA if applicable. Many employers pair level-funded plans with an Integrated HRA to give employees cost-sharing flexibility while maintaining the employer’s cost control. The BIH Plan Quality & HRA Analyzer can model whether this combination works for your demographics.

    5. Set realistic expectations. Year one savings are typically 10-15%. Surplus refunds (if earned) add another 5-15% in effective savings. The compounding benefit kicks in over years 2-4 as you build claims history and avoid the Renewal Ratchet.

    Frequently Asked Questions

    How much can a small business save with level-funded health insurance?

    Most small businesses with 25-75 employees and below-average claims save 10-30% compared to fully insured plans, inclusive of potential surplus refunds. The savings come from three sources: elimination of carrier profit margin, claims transparency, and experience-based pricing. Use the BIH Premium Renewal Stress Test to model your specific scenario.

    What happens if my employees have a bad claims year on a level-funded plan?

    Your maximum cost is capped by the stop-loss insurance built into the plan. You won’t receive a surplus refund that year, but you also won’t pay more than the maximum funded amount. The specific stop-loss covers any individual claim above the deductible threshold, and the aggregate stop-loss caps your total claims exposure for the year.

    Is level-funded insurance the same as self-funded insurance?

    No. Level-funded is a hybrid. Like self-funded plans, you’re funding claims directly and get surplus refunds. But unlike full self-funding, level-funded plans include stop-loss coverage that caps your downside risk at a predetermined maximum. This makes level-funded accessible for smaller employers who can’t absorb the volatility of pure self-funding.

    How does level-funded compare to PEO health insurance for small businesses?

    PEOs offer a different path to savings: they pool your employees with thousands of others to negotiate volume discounts with carriers. Level-funded plans save money through claims transparency and surplus refunds rather than pooling. For a detailed cost comparison, see our PEO cost analysis guide. Some employers use PEO administration alongside level-funded funding — the two aren’t mutually exclusive.

    Can I add a Taft-Hartley plan as an alternative to level-funded?

    Yes. Taft-Hartley multiemployer health plans offer another path to below-market rates by aggregating risk across multiple employers in a union trust structure. For some industries, particularly construction and manufacturing, Taft-Hartley plans can deliver even deeper savings than level-funded. BIH and PEO4YOU can model both options simultaneously using the Health Funding Cost Projector.

    Model Your Own Health Plan Cost
    Health Funding Cost Projector
    No login required. No email gate. Free.

    References

    1. Segal. “2026 Segal Health Plan Cost Trend Survey.” September 2025. segal.com
    2. PwC Health Research Institute. “Medical Cost Trend: Behind the Numbers 2026.” June 2025. pwc.com
    3. Kaiser Family Foundation. “2024 Employer Health Benefits Survey.” October 2024. kff.org
    4. Society for Human Resource Management. “Level-Funded Health Plans: What Employers Need to Know.” 2024. shrm.org
    5. Kaiser Family Foundation. “Level-Funded Plan Enrollment Growth Among Small Employers.” 2024. kff.org
    6. National Association of Insurance Commissioners. “Level-Funded Health Plan Regulatory Framework.” 2024. naic.org
    7. U.S. Department of Labor. “ERISA Compliance Assistance: Health Benefit Plans.” 2025. dol.gov
    8. Mercer. “National Survey of Employer-Sponsored Health Plans 2024.” November 2024. mercer.com

    This analysis is provided for educational purposes and does not constitute financial or legal advice. Consult your compliance counsel and benefits advisor for guidance specific to your situation.


    About the Author: Sam Newland, CFP®, has spent 13+ years in the employee benefits industry and founded Business Insurance Health and PEO4YOU to bring transparency to an industry that profits from complexity. His approach is simple: show employers the real numbers and let them decide.

  • Captive Insurance for Employee Benefits: Taking Back Control of Costs

    Captive Insurance for Employee Benefits: Taking Back Control of Costs

    Every year, your insurance carrier collects premiums on your voluntary benefits — dental, vision, life, disability, accident, critical illness. They pay out claims. And they keep the difference. For most voluntary benefit lines, carriers retain 40-55% of premiums as profit, overhead, and reserves.

    What if you could keep that margin instead?

    That’s the premise behind captive insurance for employee benefits — a structure where employers (individually or in a group) form their own insurance entity to underwrite voluntary benefit lines, retain the underwriting profit, and maintain the same employee-facing coverage. It’s not new in property and casualty insurance, where over 40% of Fortune 500 companies use captives. But it’s increasingly available to mid-size employers for employee benefits — and most brokers have never heard of it.

    At Business Insurance Health and PEO4YOU, we’ve evaluated captive structures for employers with 50-300+ employees. When the model fits, it transforms voluntary benefits from a cost center into a profit center — literally returning underwriting margin to the employer’s bottom line.

    Key Takeaways
    • Traditional carriers retain 40-55% of voluntary benefit premiums as profit and overhead. Captive structures return this margin to the employer.
    • The “Carrier Margin Recapture Model”: employers form or join a group captive that underwrites voluntary lines (dental, vision, life, disability, accident, critical illness) at a target loss ratio of 45-55%.
    • Employers with 50-300+ employees and stable voluntary benefit participation rates are ideal captive candidates.
    • First-year ROI depends on participation rates and claims experience, but mature captive programs typically return 15-35% of total voluntary benefit premiums to the employer.
    • ERISA fiduciary obligations apply — proper legal structure and actuarial support are essential.
    Captive insurance for employee benefits showing how employers recapture underwriting profit

    How Captive Insurance Works for Voluntary Employee Benefits

    A captive insurance company is an insurance entity owned by the employer (or a group of employers) that underwrites risk the owner would otherwise transfer to a commercial carrier. In the employee benefits context, here’s how the flow changes:

    Traditional Model vs. Captive Model

    Flow Step Traditional Carrier Captive Model
    Premiums collected Employer/employee to Carrier Employer/employee to Captive
    Claims paid Carrier pays from premiums Captive pays from premiums
    Excess (profit) Carrier retains 40-55% Returns to employer (15-35%)
    Risk protection Carrier assumes all risk Reinsurance/stop-loss caps downside
    Rate setting Carrier sets rates (opaque) Actuary sets rates (transparent)
    Data access Limited claims data Full claims transparency

    The mechanics are straightforward: instead of sending voluntary benefit premiums to MetLife, Guardian, or another carrier, the premiums flow into the captive entity. The captive pays claims, purchases reinsurance for catastrophic risk, and distributes the remaining surplus — the underwriting profit — back to the employer-owner.

    The Carrier Margin Recapture Model: Where the Money Goes

    Let’s trace a typical voluntary benefit dollar to show why captives create value:

    Voluntary Benefit Premium Dollar Allocation

    Component Traditional Carrier Captive Model
    Claims paid 45-55 cents 45-55 cents
    Admin/overhead 15-20 cents 8-12 cents
    Reinsurance/stop-loss Included in carrier margin 5-8 cents
    Carrier profit/surplus 15-25 cents (retained by carrier) 0 cents (no carrier profit layer)
    Returned to employer $0 15-35 cents

    The target loss ratio in a well-structured captive program is 45-55% — meaning 45-55 cents of every premium dollar goes to claims, with the remainder covering administration, reinsurance, and employer surplus. Compare this to traditional carriers where the employer sees zero return regardless of claims experience.

    BIH model based on anonymized captive program data. Target loss ratios vary by benefit line: dental typically runs 50-60%, vision 40-50%, life/disability 30-45%, accident/critical illness 25-40%.

    Voluntary benefit premium dollar allocation comparing traditional carrier retention vs captive model employer return

    The Hidden Math: Captive ROI for a 100-Employee Company

    Parameter Value
    Employees enrolled in voluntary benefits 80-100 (75-85% participation)
    Annual voluntary benefit premiums $180,000-$240,000 (dental + vision + life + disability + supplemental)
    Traditional carrier retention 40-55% = $72,000-$132,000 kept by carrier
    Captive target loss ratio 45-55%
    Captive admin + reinsurance 13-20% = $23,400-$48,000
    Estimated employer surplus (Year 1) $27,000-$84,000 (15-35% of premiums)
    3-Year cumulative return (if stable claims) $81,000-$252,000

    The recapture: $27,000-$84,000 per year that was previously carrier profit, now returned to the employer. For a 200-employee company, double these figures. For a 50-employer group captive pooling 5,000+ lives, the aggregate economics are even more compelling.

    Model your own scenario using the BIH Health Funding Cost Projector, which can compare captive structures against level-funded plans, Taft-Hartley trusts, and fully insured arrangements side by side.

    Model Your Own Funding Strategy Comparison
    Health Funding Cost Projector
    No login required. No email gate. Free.

    Who Should Consider Captive Insurance for Employee Benefits?

    Based on our evaluation work at BIH and PEO4YOU, the strongest captive candidates share these traits:

    50-300+ employees with stable voluntary benefit enrollment. The captive needs sufficient premium volume to be actuarially credible. Smaller employers can access group captives where multiple companies pool premium.

    High voluntary benefit participation rates (65%+ enrollment). The higher the participation, the larger the premium base, and the more predictable the claims experience. Employers with strong benefits cultures and generous employer contributions see the best results.

    Willingness to accept fiduciary responsibility. As an ERISA-governed arrangement, captive programs require proper legal structure, actuarial support, and trustee oversight. This isn’t a set-it-and-forget-it solution — it’s an active risk management strategy that rewards engaged employers.

    Multi-year commitment. Captive programs deliver the best ROI over 3-5+ years as claims data builds and the program matures. Year-one returns may be modest; years 3-5 are where the compounding benefit of retained underwriting profit becomes significant.

    For employers not ready for a full captive, level-funded health plans offer a simpler entry point to self-funded economics with surplus refund potential. Think of level-funded as the on-ramp and captive as the destination for employers seeking maximum cost control.

    Ideal captive insurance candidate criteria showing employee count participation rates and commitment requirements

    Risks and Considerations for Employer Captive Programs

    ERISA fiduciary obligations. The employer (or trust) that sponsors the captive has fiduciary duties to plan participants under ERISA. This means prudent management of plan assets, proper disclosure, and acting in participants’ best interests. Violations can result in personal liability for fiduciaries. Work with ERISA counsel.

    Claims volatility in early years. With less premium volume, small captives are more susceptible to adverse claims experience. Reinsurance mitigates catastrophic risk, but a bad claims year can eliminate the surplus. The BIH Benefits Savings Strategy Builder models both conservative and aggressive claims scenarios.

    Regulatory complexity. Captive insurance companies are domiciled in specific jurisdictions (Vermont, Utah, and several offshore domiciles are popular for employee benefit captives). Each jurisdiction has its own capital requirements, reporting obligations, and regulatory framework.

    Not a fit for major medical (usually). Most employer captives focus on voluntary/ancillary benefit lines where loss ratios are predictable and margins are wide. Major medical captives exist but require significantly more scale and risk tolerance. For major medical alternatives, see our guides on Taft-Hartley trusts and mid-size employer strategies.

    Frequently Asked Questions

    What is captive insurance for employee benefits?

    Captive insurance is a structure where employers form their own insurance entity to underwrite voluntary benefit lines (dental, vision, life, disability, supplemental) instead of purchasing coverage from a commercial carrier. The employer retains the underwriting profit that a traditional carrier would keep — typically 15-35% of premiums in a well-managed program.

    How much can an employer save with a captive insurance program?

    Savings depend on company size, participation rates, and claims experience. A 100-employee company with $180,000-$240,000 in annual voluntary benefit premiums can expect employer surplus returns of $27,000-$84,000 per year once the program matures. Use the BIH Health Funding Cost Projector to model your scenario.

    Is captive insurance the same as self-funded health insurance?

    They share the concept of employer-retained risk, but differ in structure. Self-funded health plans (including level-funded) typically cover major medical. Captive insurance for employee benefits usually covers voluntary/ancillary lines (dental, vision, life, disability, supplemental) where loss ratios are more predictable and carrier margins are wider.

    What are the ERISA requirements for employer captive programs?

    ERISA requires captive program sponsors to act as fiduciaries: managing plan assets prudently, disclosing plan information to participants, and acting solely in participants’ best interests. This requires legal counsel experienced with ERISA welfare benefit plans and actuarial support for rate-setting and reserve calculations.

    Can small businesses join a group captive for employee benefits?

    Yes. Group captives pool multiple employers into a single captive entity, spreading risk and achieving premium volume that individual small employers couldn’t reach alone. Some programs accept employers with as few as 25-50 employees. At BIH and PEO4YOU, we can evaluate whether individual or group captive structures fit your company’s profile.

    Model Your Own Benefits Savings Potential
    Benefits Savings Strategy Builder
    No login required. No email gate. Free.

    References

    1. Conning. “Voluntary Benefits Market Report: Carrier Retention Ratios.” 2024. conning.com
    2. Marsh. “Captive Landscape Report: Fortune 500 Captive Utilization.” 2025. marsh.com/captive-solutions
    3. Captive Insurance Companies Association (CICA). “Employee Benefits Captive Best Practices.” 2024. cicaworld.com
    4. U.S. Department of Labor. “ERISA Fiduciary Responsibilities for Welfare Benefit Plans.” 2025. dol.gov/agencies/ebsa
    5. Vermont Department of Financial Regulation. “Captive Insurance Division: Annual Report.” 2025. dfr.vermont.gov/captive-insurance
    6. Business Group on Health. “2026 Large Employer Health Care Strategy Survey.” 2025. businessgrouphealth.org
    7. Willis Towers Watson. “Alternative Risk Transfer: Employee Benefits Captive Programs.” 2024. wtwco.com
    8. Kaiser Family Foundation. “2024 Employer Health Benefits Survey.” October 2024. kff.org

    This analysis is provided for educational purposes and does not constitute financial or legal advice. Consult your compliance counsel and benefits advisor for guidance specific to your situation.


    About the Author: Sam Newland, CFP®, has spent 13+ years in the employee benefits industry and founded Business Insurance Health and PEO4YOU to bring transparency to an industry that profits from complexity. His approach is simple: show employers the real numbers and let them decide.

  • PEO Health Insurance for Construction Companies

    PEO Health Insurance for Construction Companies

    Your construction company’s health insurance quote just came in, and the numbers are exactly what you expected: unaffordable. The 55-year-old project manager is quoted at $1,200/month while the 28-year-old apprentice is at $450. Half your workforce can’t afford the premiums, so enrollment stays low — which keeps you in the small group market where rates are highest.

    This is the cycle that traps thousands of construction companies every year. PEO health insurance for construction businesses breaks that cycle by replacing age-banded individual quotes with flat-rate, community-rated premiums that make coverage affordable for every employee regardless of age.

    Key Takeaways
    • PEO master policies replace age-banded premiums with flat rates (e.g., $471/month PPO for all ages)
    • Older employees save 30-50% on premiums; younger employees see minimal change
    • Higher enrollment rates improve your negotiating position and reduce per-employee costs
    • PEOs can bundle workers’ comp with health insurance, often lowering combined costs
    • Pay-as-you-go workers’ comp eliminates large down payments and year-end audits

    Why Age-Banded Pricing Kills Construction Company Enrollment

    In the traditional small group market, health insurance premiums are age-banded — meaning every employee’s rate is different based on their age. In construction, where the workforce often skews older and more experienced, this creates a brutal math problem.

    When we analyzed the situation for a heavy construction firm with 25-35 employees, the age-banding effect was stark:

    Employee Age Age-Banded Premium PEO Flat Rate Monthly Savings
    28 $480/month $471/month $9
    42 $720/month $471/month $249
    55 $1,100/month $471/month $629
    62 $1,350/month $471/month $879
    Age-banded versus PEO flat-rate health insurance premium comparison for construction company employees by age

    The employees who most need health insurance — experienced, older workers with families — are the ones most priced out by age-banded quotes. A PEO health insurance construction model solves this by pooling your employees into a master policy with community-rated pricing where everyone pays the same base rate.

    For the construction firm, this meant their most experienced employees — the ones generating the most revenue and who were hardest to replace — could suddenly afford coverage. Enrollment interest jumped from 30% to over 70% of the workforce.

    How PEO Group Buying Power Works for Construction

    A PEO (Professional Employer Organization) operates a master health insurance policy covering employees from hundreds of member businesses. Your 30 employees join a risk pool of 20,000+ lives, giving you access to large-group rates that no 30-employee construction company could negotiate independently.

    The practical benefits for construction companies:

    • Flat-rate premiums instead of age-banded — the same rate for a 25-year-old laborer and a 60-year-old superintendent
    • Major carrier networks (UHC, Cigna, Aetna, Blue Cross) — your employees keep their doctors
    • Voluntary benefits at no employer cost — dental, vision, and disability with no minimum enrollment requirements
    • Tax-advantaged accounts — HSAs, Dependent Care FSAs, and Limited Purpose FSAs that reduce taxable income for employees

    The lowest-cost PPO option for the construction firm was $471/month per employee — a flat rate regardless of age, gender, or health status. Compare this against their existing quotes where just the 55+ employees were paying $1,100-$1,350/month.

    You can model how different premium structures affect your total benefits cost using the Premium Renewal Stress Test to compare age-banded vs. flat-rate scenarios for your specific workforce.

    Workers’ Comp + Health Insurance: The Combined PEO Advantage

    For construction companies, health insurance is only half the benefits equation. Workers’ compensation is typically the largest insurance expense, and PEOs offer structural advantages here too.

    The construction firm had an Experience Modification Rate (EMR) of 1.11 — above the baseline of 1.0, which meant they were paying an 11% penalty on workers’ comp premiums due to historical claims. Through a PEO, the firm could potentially access the PEO’s lower EMR, reducing their workers’ comp rate.

    Additional workers’ comp advantages through a PEO include:

    • Pay-as-you-go billing eliminates the large down payment (typically 25% of annual premium) required for standalone policies
    • No year-end audit surprises — premiums adjust automatically based on actual payroll
    • Risk management support with dedicated safety programs, which is critical for blue-collar workers’ comp solutions
    • Claims management with advocacy for faster return-to-work outcomes

    When we combined health insurance savings and workers’ comp improvements for the construction firm, the total projected savings reached $35,000-$45,000 annually — before accounting for the HR administrative time reclaimed by outsourcing to the PEO.

    Combined PEO health insurance and workers compensation savings projection for construction companies


    The Participation Challenge: Spanish-Speaking and Foreign-Insured Workers

    A unique challenge for construction companies is workforce diversity in insurance needs. The firm we worked with had 7-8 employees with foreign insurance that provided superior coverage to any domestic option. These employees wouldn’t enroll in a U.S. group plan regardless of price.

    This matters because PEOs typically require 30-50% minimum participation among eligible employees. If 25% of your eligible workforce will never enroll, you need near-total participation from the remaining 75% to meet thresholds.

    The solution: clearly define eligible employee classes. Employees with documented foreign coverage may be excluded from eligibility calculations — maintaining compliance without forcing enrollment. (Confirm this approach with your compliance counsel, as ACA participation rules vary by plan structure.) This is a nuance most brokers miss, and it’s one more reason to work with a PEO experienced in construction workforce dynamics.

    For strategies on cutting costs while maintaining quality benefits, understanding participation dynamics is essential.

    Beyond Health: The Full PEO Benefits Stack for Construction

    Health insurance gets the most attention, but the PEO model delivers additional benefits that matter specifically to construction companies:

    Dental with meaningful maximums: Most standalone small group dental plans cap at $1,000-$1,500 annually. PEO dental plans can offer $5,000 annual maximums with orthodontia — a significant differentiator for recruiting.

    Disability insurance: Construction work carries inherent physical risk. Offering short-term and long-term disability as voluntary (employee-paid) benefits provides a safety net at no employer cost.

    Dependent Care FSA: For construction employees with young children, pre-tax dependent care spending saves approximately 25% on childcare expenses — an overlooked benefit that increases take-home pay without costing the employer anything.

    EPLI coverage: Employment Practices Liability Insurance protects your business from employee lawsuits related to wrongful termination, discrimination, or harassment — with typical coverage of $1-2 million, often included in the PEO admin fee or available as a low-cost add-on.

    Learn more about how PEO health insurance works across industries and what to expect from the enrollment process.

    Complete PEO benefits package for construction companies including health dental vision disability and EPLI

    Use the Benefits Savings Strategy Builder and Health Funding Projector to model a complete PEO package — including health, workers’ comp, and ancillary benefits — for your construction company.

    For a detailed ROI analysis of how benefits investments pay for themselves in construction, see our framework for calculating construction employee benefits ROI.


    Frequently Asked Questions

    How much can a construction company save on health insurance through a PEO?

    Based on our analyses across multiple construction clients, employers save 20-40% on per-employee health insurance premiums by switching from small group age-banded plans to PEO community-rated pricing. The largest savings accrue to companies with older workforces, where age-banded rates create the greatest disparity.

    Does a PEO cover workers’ comp for construction trades?

    Yes, most PEOs offer workers’ compensation coverage for construction trades, though approval depends on the PEO’s risk appetite and your claims history. The PEO evaluates your Experience Modification Rate (EMR), loss runs, and safety protocols during underwriting. Companies with higher EMRs may pay more but can still benefit from the PEO’s group rate.

    What’s the minimum company size for a construction PEO?

    Most PEOs require a minimum of 5-10 employees. For construction companies specifically, the sweet spot is 15-75 employees — large enough to benefit from group buying power but small enough that standalone large-group plans aren’t yet accessible.

    Can PEO employees still use their existing doctors and hospitals?

    Yes. PEOs contract with major carrier networks (UHC, Cigna, Aetna, Blue Cross) that include the vast majority of providers. During evaluation, verify that your employees’ current providers are in-network by checking the specific carrier and plan type offered through the PEO.

    How does PEO health insurance affect my high-cost claimant situation?

    PEO master policies dramatically reduce the impact of high-cost claimants by diluting individual claims across a pool of 20,000+ lives. A $500,000 claim that would spike a 30-employee group’s rates by 30-40% has less than a 0.5% impact on a PEO’s master policy pool.


    If you want to see how PEO flat-rate pricing compares to your current age-banded quotes, the Premium Renewal Stress Test lets you model it yourself with your actual workforce demographics.


    About the Author: Sam Newland, CFP®, has spent 13+ years in the employee benefits industry and founded Business Insurance Health and PEO4YOU to bring transparency to an industry that profits from complexity. His approach is simple: show employers the real numbers and let them decide.

  • Construction Employee Benefits ROI: A Framework

    Construction Employee Benefits ROI: A Framework

    Every construction company owner knows the cost of benefits down to the penny. Very few know the cost of not having them. That’s because turnover, extended vacancies, productivity loss, and subcontractor premiums don’t appear on a single line item — they’re distributed across the P&L in ways that make them invisible.

    When we built a construction company employee benefits ROI model for a specialty contractor with 20-30 employees, the result surprised even the owner: the projected return was $98,700 annually — more than double the cost of the benefits program itself. The math wasn’t theoretical. It was based on their specific turnover data, revenue-per-employee figures, and time-to-hire metrics.

    Key Takeaways
    • The true cost of losing one skilled construction employee is $40,000-$90,000 (recruiting, training, productivity loss)
    • A benefits package that reduces annual turnover by even 2 employees generates $80,000-$180,000 in saved costs
    • Reimbursing employees for individual health insurance is non-compliant under IRS rules — and exposes your business to penalties
    • Shifting from subcontractors to W-2 employees (enabled by benefits) can save 10-15% on labor costs
    • The ROI framework below uses 5 variables you already track

    The Hidden Math: What Turnover Actually Costs a Construction Company

    SHRM estimates that replacing an employee costs 50-200% of their annual salary. In construction, the number skews higher because of specialized skills, safety training requirements, and the revenue impact of unfilled positions on active projects.

    Here’s how we calculated it for the specialty contractor:

    Turnover Cost Component Per Employee
    Recruiting and hiring $5,000-$8,000
    Safety training and onboarding $3,000-$5,000
    Productivity ramp-up (3-6 months) $15,000-$25,000
    Lost revenue during vacancy $20,000-$50,000
    Total cost per turnover event $43,000-$88,000

    The contractor was losing approximately 4 employees per year. With a benefits program projected to reduce that to 2, the turnover savings alone justified the investment. But turnover was only one variable.

    Construction employee turnover cost breakdown from recruiting through lost revenue per separation event


    The 5-Variable ROI Framework

    You don’t need a consultant to calculate your benefits ROI. Here are the five inputs, all of which you already know or can estimate:

    Variable 1: Annual Turnover Reduction

    Formula: (Current annual separations – Projected separations with benefits) × Average cost per turnover event

    For the contractor: (4 – 2) × $44,000 = $88,000 in annual savings

    According to BLS.gov, the construction industry’s average separation rate is among the highest of any sector. Benefits are the most direct lever you have to reduce it, especially for project managers and skilled tradespeople who generate the most revenue per capita.

    Variable 2: Time-to-Hire Reduction

    Formula: (Days saved per hire × Daily revenue impact per vacancy) × Annual hires

    Construction companies offering competitive benefits packages reduce their average time-to-hire by 15-30 days. For the contractor, cutting hiring time from 45 to 30 days across 6 annual hires translated to roughly $4,500 in recovered productivity.

    Variable 3: Productivity and Morale Impact

    This is the hardest variable to quantify — but it’s real. When we modeled a morale improvement from 85 to 90 (on a 100-point internal engagement scale), the projected productivity gain was approximately $3,200 annually across the workforce. Conservative? Yes. Real? Also yes.

    Understanding employee burnout signs helps you identify where benefits investments have the highest impact on retention and productivity.

    Variable 4: HR Administrative Time Savings

    If someone on your team is spending 8-10 hours per week on benefits administration, payroll questions, and compliance tasks, that’s $15,000-$25,000 annually in loaded labor cost. A PEO or properly administered benefits program reclaims that time.

    For the contractor: estimated savings of $3,000 annually (conservative, based on 5 reclaimed hours per week at a blended administrative rate).

    Variable 5: Subcontractor-to-W2 Conversion Savings

    This is the multiplier most contractors miss entirely. Subcontractors typically cost 10-20% more than W-2 employees performing the same work, because you’re paying their overhead, profit margin, and insurance mark-up on top of their labor rate.

    The specialty contractor was running approximately 60% subcontracted labor on a $350,000-$400,000 monthly spend. Shifting even 10% of that volume to W-2 employees — which requires offering benefits to attract them — was projected to save $40,000-$60,000 annually.

    Total projected ROI: $98,700 against an estimated benefits investment of $48,000 in employer contributions plus $22,000 in PEO admin fees — a 140% return.

    Build your own projection using the Benefits ROI Calculator, which lets you input your specific variables and model multiple scenarios.

    Five-variable benefits ROI framework for construction companies with calculation formulas


    The Compliance Problem Most Contractors Don’t Know They Have

    Here’s a critical issue that affects thousands of construction companies: reimbursing employees for individual health insurance is non-compliant under IRS rules. If you’re giving employees a flat amount to buy their own marketplace plans, you’re violating ACA employer mandate provisions — and the penalties can be significant.

    The specialty contractor had been reimbursing select employees informally for years. This is technically an employer health plan that fails minimum essential coverage requirements, exposing the business to IRS penalties of up to $100 per day per affected employee — that’s $36,500 per employee per year if uncorrected.

    The fix isn’t complicated, but it requires moving to a compliant structure — either a formal group plan, a PEO, or an ICHRA (Individual Coverage Health Reimbursement Arrangement). The point is that doing nothing carries more risk than most contractors realize.

    For a comprehensive approach to structuring your employee benefits for a small business, start with compliance first and optimize from there. Also review how your benefits strategy contributes to your small business benefits package positioning for talent acquisition.

    Choosing the Right Benefits Model

    For construction companies with 15-50 employees, three models typically compete:

    Model Best For Employer Cost Range Key Advantage
    PEO 15-50 employees, want full HR outsourcing $200-$400/mo/employee Large-group rates, turnkey HR
    ICHRA Want to keep current payroll, flexible contributions Employer-defined contribution Employee choice, cost control
    Direct Group Plan 50+ employees with low claims history Varies by carrier Maximum plan design control

    The contractor chose the PEO model for its combination of insurance savings, HR outsourcing, and workers’ comp integration — all of which contributed to the ROI calculation above. The Business Valuation Tool can help you understand how a formal benefits program affects your company’s enterprise value, which matters if you’re planning to sell or bring on investors within the next 5-10 years.

    Three employee benefits models compared for construction companies showing PEO ICHRA and direct group plan


    If you’re ready to explore PEO-specific benefits for your construction business, see our detailed guide on PEO health insurance for construction companies.


    Frequently Asked Questions

    How much do employee benefits cost for a construction company?

    Employer contributions for construction company benefits typically range from $200-$500 per employee per month, depending on plan design and the employer’s contribution strategy. Most employers contribute 50-80% of the lowest-cost plan and let employees buy up to richer options at their own expense.

    Is reimbursing employees for health insurance legal?

    Informal reimbursement of individual health insurance premiums is non-compliant under IRS rules unless structured as an ICHRA or QSEHRA. Penalties can reach $100 per day per affected employee. If you’re currently reimbursing employees, consult a benefits advisor to move into a compliant structure immediately.

    What’s the average turnover rate in construction?

    The Bureau of Labor Statistics reports that construction has one of the highest separation rates across all industries, with annual turnover often exceeding 60% for field labor. Skilled positions (project managers, estimators, senior tradespeople) have lower turnover but much higher replacement costs.

    Can part-time construction workers receive benefits through a PEO?

    Yes, most PEOs can extend benefits to part-time employees. The employee typically pays the difference between the part-time and full-time admin rate. Benefits must be offered to compliant employee classes (not individual employees) to maintain IRS compliance.

    How do I calculate my specific benefits ROI when switching PEO providers?

    Use the 5-variable framework in this article with your actual data: annual turnover events, cost per hire, productivity metrics, admin hours spent on HR tasks, and subcontractor labor percentage. The Benefits ROI Calculator at businessinsurance.health automates this calculation.


    If you want to see how benefits affect your business valuation or model the turnover savings for your specific headcount, the Business Valuation Tool and Benefits ROI Calculator let you run the numbers yourself.


    About the Author: Sam Newland, CFP®, has spent 13+ years in the employee benefits industry and founded Business Insurance Health and PEO4YOU to bring transparency to an industry that profits from complexity. His approach is simple: show employers the real numbers and let them decide.

  • Health Insurance for Businesses with High-Cost Claimants

    Health Insurance for Businesses with High-Cost Claimants

    Your best employee — the one who’s been with you since the beginning, who trains new hires and keeps operations running — just generated a claim that’s about to make your health insurance unaffordable. One employee with a chronic condition or catastrophic event can produce claims exceeding $500,000 in a single year, and in the small group market, that translates directly to premium increases of 40% or more.

    In 2026, this scenario is hitting harder than ever. With marketplace subsidies shrinking, employees who previously self-insured through the individual market are now seeking employer coverage — often bringing high-cost claim histories with them. For employers with 20-100 employees, the challenge is stark: you can’t afford to not offer insurance (you’ll lose talent), and you can’t afford the quotes you’re getting.

    Key Takeaways
    • A single high-cost claimant ($500K+ in annual claims) can increase small group premiums by 30-50%
    • PEO master policies pool your employees with thousands of others, diluting individual claim impact
    • Self-funded captive models give employers with 20+ enrollees cost control and premium stability
    • Marketplace subsidy reductions in 2026 are driving more high-cost employees into employer plans
    • Simplified underwriting through a PEO can bypass traditional medical questionnaires entirely

    Why High-Cost Claimants Hit Small Businesses Hardest

    In a fully insured small group plan, your premium is your claims experience. Insurance carriers set rates based on the medical history of your specific employee population. One employee on a $20,000/month biologic for rheumatoid arthritis or one catastrophic surgery adds $240,000+ in annual claims to a pool that might only generate $300,000 in total premium.

    The math is unforgiving. When we analyzed the situation for a growing healthcare practice with 35-60 employees, they’d received quotes ranging from $40,000 to $50,000 per month — for just 10 enrollees. That’s roughly $590,000 annually. The cause: two high-cost claimants, including one with a claim history exceeding $2 million.

    No amount of plan design changes fixes this. Raising deductibles, switching networks, or adding cost-sharing only shifts dollars between the employer and employees — it doesn’t change the underlying risk that carriers are pricing.

    This is where most brokers stop. They present the renewal, apologize for the increase, and suggest shopping the same plan design to three carriers. What they don’t present are the structural alternatives that actually solve the problem.

    Option 1: PEO Master Policy — Diluting Risk Through Scale

    A Professional Employer Organization operates a master health insurance policy that covers employees from hundreds of businesses. When your 35 employees join a PEO’s plan that covers 20,000+ lives, your high-cost claimant becomes a fraction of a percentage of the total risk pool rather than 10% of it.

    The practical impact is dramatic:

    Factor Small Group Direct PEO Master Policy
    Risk pool size 10-60 employees 20,000+ lives
    Impact of $2M claimant 30-50% rate increase <0.5% impact on pool
    Underwriting approach Full medical history Simplified underwriting
    Rate structure Age-banded (older = more) Community-rated (flat rate)
    Premium stability Subject to annual volatility ≤3% annual increases
    Risk pool size comparison showing impact of high-cost claimant in small group versus PEO master policy

    For the healthcare practice we worked with, simplified underwriting through a PEO meant presenting the $2 million claim as context rather than a disqualifying event. The underwriter evaluates whether the claim pattern is ongoing or was a one-time catastrophic event — a fundamentally different question than “what did this person cost last year?”

    The PEO model also replaces age-banded rates with flat, community-rated premiums. For a workforce with older employees, this alone can reduce individual premium costs by 30-50%. You can project how different funding structures affect your costs using the Health Funding Projector to compare PEO vs. direct insurance scenarios.

    Option 2: Self-Funded Captive — Control for Groups with 20+ Enrollees

    For employers with 20 or more employees enrolling in coverage, a self-funded captive offers an alternative that provides cost control, plan flexibility, and premium stability without the claim volatility that destroys small group rates.

    Here’s how it works: your business joins a captive — a community of employers who pool risk together. Claims are managed in three tiers:

    • Retained layer: Your business pays predictable, small claims (under $25,000)
    • Shared captive layer: Medium claims ($25,000-$250,000) are spread across all captive members
    • Stop-loss protection: Catastrophic claims above $250,000 are transferred to a stop-loss carrier

    This structure means your $2 million claimant’s costs are absorbed primarily by the stop-loss layer — not by your business alone. The captive model provides direct access to major carrier networks (Blue Cross, UHC, Aetna) through a Third-Party Administrator (TPA), often with better service and more flexibility than going direct.

    For employers who want plan design control — choosing deductibles, copays, and network — the captive model offers customization that PEO master policies typically don’t. Learn more about how multiemployer plans offer better health insurance through similar risk-pooling structures.

    Self-funded captive insurance three-tier claims structure diagram for small businesses


    The Marketplace Subsidy Factor: Why 2026 Is Different

    In 2025-2026, the reduction of enhanced ACA marketplace subsidies created a cascade effect that directly impacts employer plans. Employees who previously self-insured through the marketplace at subsidized rates are now finding individual coverage unaffordable — and they’re looking to their employer for coverage.

    For the healthcare practice we analyzed, this shift was dramatic: employee interest in group coverage jumped from 10 employees to 30 when marketplace premiums became unsubsidized. That’s good for participation rates — but it also means employers are absorbing employees who may have been managing expensive conditions through individual plans.

    The timing creates a strategic window. Employers who can offer affordable group coverage now will retain employees who might otherwise leave for larger companies with established benefits. Understanding your integrated HRA options can help you structure coverage that’s affordable for both the employer and employees with high healthcare needs.

    Timeline showing marketplace subsidy reduction impact on small business group enrollment 2025-2026


    How to Frame High-Cost Claims for Underwriters

    Whether you’re pursuing a PEO or captive, how you present high-cost claimant data matters. Underwriters evaluate risk, not just cost. A $2 million claim from a one-time surgical event signals different risk than $2 million in ongoing chronic condition management.

    When we prepared the simplified underwriting form for the healthcare practice, we helped frame each high-cost claimant’s situation with clinical context: whether the condition was resolved or ongoing, whether the treatment protocol was likely to continue at the same cost level, and what the employee’s prognosis indicated about future claims.

    This context transforms the underwriting conversation from “this group costs too much” to “here’s why the historical claims don’t predict the future.”

    Use the Premium Renewal Stress Test to model how your claims history affects pricing across different plan structures — it helps you walk into underwriting conversations with data rather than anxiety.

    To understand how this same challenge plays out for trade businesses dealing with workers’ comp and health insurance simultaneously, see our guide on PEO health insurance for construction businesses.


    Frequently Asked Questions

    Can a PEO accept employees with pre-existing conditions?

    Yes. PEO master policies operate as large group plans, which means they cannot exclude employees based on pre-existing conditions. Simplified underwriting evaluates the overall group risk profile, not individual medical histories. This is one of the primary advantages for employers with high-cost claimants.

    What is a self-funded captive and how does it differ from traditional self-funding?

    A self-funded captive pools multiple employers together to share risk, providing the cost control of self-funding with the stability of group risk spreading. Unlike traditional self-funding where one employer bears all claim risk, the captive structure distributes medium-sized claims across members and transfers catastrophic claims to stop-loss insurance.

    How much can a PEO reduce premiums for businesses with high-cost claimants?

    Results vary based on group demographics and claim history, but we’ve seen small businesses reduce per-employee premium costs by 20-40% by moving from small group direct insurance to a PEO master policy. The savings come from risk pool dilution and community-rated (rather than age-banded) premium structures.

    Will marketplace subsidy changes in 2026 affect my group plan costs?

    Indirectly, yes. As enhanced marketplace subsidies decrease, more employees will seek employer-sponsored coverage, increasing your enrollment. Higher enrollment can improve your negotiating position but may also bring in employees with higher healthcare utilization, which affects fully insured rates. PEO and captive models mitigate this risk through pool size.

    What size business qualifies for a self-funded captive?

    Most captive programs require a minimum of 20 enrolled employees. Below that threshold, the risk pool is too small for effective claims spreading. For businesses with fewer than 20 enrollees, a PEO master policy typically provides better risk dilution. Read about how PEO honeymoon rates can complicate pricing decisions for smaller groups.


    If you want to compare how PEO, captive, and fully insured models perform with your specific claims profile, the Health Funding Projector lets you model all three scenarios side by side.


    About the Author: Sam Newland, CFP®, has spent 13+ years in the employee benefits industry and founded Business Insurance Health and PEO4YOU to bring transparency to an industry that profits from complexity. His approach is simple: show employers the real numbers and let them decide.