

Most employers with 20 to 250 employees have no idea what their group health plan's loss ratio is. They know what they pay in premiums. They hear from their broker when it is time to renew. They accept the rate increase, sign the paperwork, and move on. What they rarely see is the number that actually determines what options they have at renewal — and whether a 9% rate hike is the best they can do or just the easiest path for everyone involved.
Here is the scenario that comes up more than most employers realize. A company with around 60 employees pays $647,000 a year in health plan premiums. Over the past 12 months, their group generated $540,000 in actual medical claims. That math produces an 83% loss ratio — a number most brokers never show their clients, and one that, if you know how to use it, opens doors to alternative funding arrangements that can meaningfully reduce what you spend on employee health coverage over the next several years.
This article explains what a loss ratio is, how to find yours, and what it determines about your options. We have built a framework called the Loss Ratio Ladder to show which tier you are in and which funding strategies become available at each level.
Your loss ratio is simple math. Take total claims your employees and dependents generated over the past 12 months, divide by total premiums your group paid over the same period, and multiply by 100. If your group paid $647,000 in premiums and generated $540,000 in claims, your loss ratio is 83.5% — meaning 84 cents of every premium dollar went toward actual medical bills, and the remaining 16 cents covered the carrier's administrative costs, reserves, and margin.
This number matters because carriers use it to price your renewal, and alternative funding arrangements use it to assess whether your group is a good candidate for a different model. A favorable loss ratio is an asset — like a low workers' compensation experience modification rate, it has real financial value. According to the KFF 2024 Employer Health Benefits Survey, the average family health plan premium reached $23,968 in 2024.¹ Even a modest reduction in loss ratio-driven renewal increases can save mid-size employers tens of thousands of dollars annually.
When your renewal comes around, your carrier compares actual claims to what they projected when they priced your group. If claims came in lower than projected — exactly what an 83% loss ratio on a historically-priced group often represents — the carrier still applies their standard trend factor and keeps the difference. This is not a conspiracy; it is how fully-covered group health funding works. The carrier takes on claims risk, so they price conservatively. But when your loss ratio is favorable, you are paying for risk protection at a level that alternative funding models would let you reduce — in exchange for capturing the savings when your group stays healthy.
Most employers do not know their loss ratio because no one has shown it to them. Your broker receives it. Your carrier calculates it. But unless you specifically ask, it rarely makes it onto a renewal presentation slide.
Here is how to find it yourself.
Ask your broker or carrier for your group's Annual Claims Experience Report, sometimes called a Claims Summary or Utilization Report. This document shows total premiums collected, total claims paid, large claims (typically any individual claim above $25,000 or $50,000), and the resulting loss ratio. Your broker should be able to have this in your hands within two to five business days. If they cannot or will not provide it, that is worth noting — it is your data.
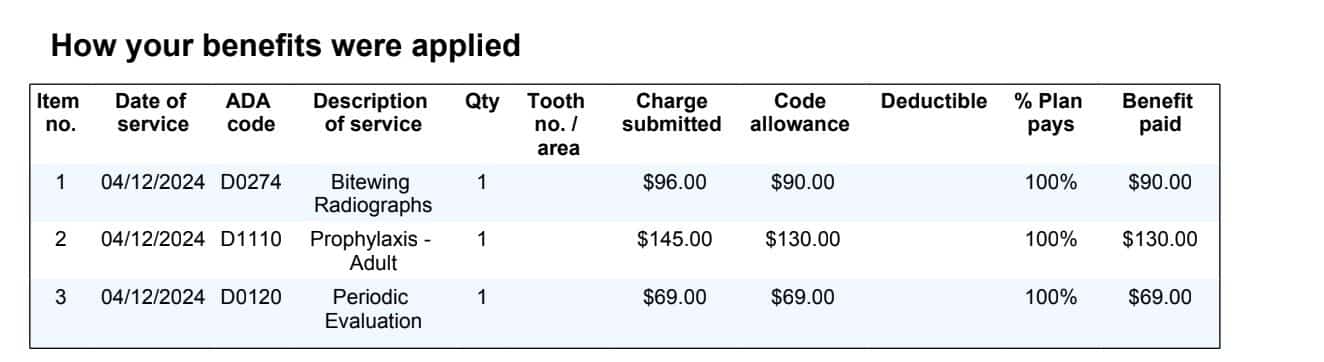
If you have access to your Summary of Benefits and Coverage (SBC) along with your Explanation of Benefits (EOB) statements, you can estimate your loss ratio without waiting on your carrier. Add up all EOB claim amounts paid by the plan over 12 months. Divide by total premiums paid (employer plus employee contributions). That is your loss ratio.
This calculation works best for fully-covered plans where the carrier is paying claims directly. For level-funded plans, your third-party administrator (TPA) should have a monthly claims report that makes this even easier.
If your group had one or two very high-cost claims — a cancer diagnosis, a premature birth — those events can skew your loss ratio significantly. Ask your broker for both your raw loss ratio and a normalized loss ratio that removes claims above a specific threshold (usually $50,000 or $100,000 per individual). The normalized number gives a more accurate picture of your group's typical cost structure, and alternative funding underwriters use it extensively.
We use a simple framework called the Loss Ratio Ladder to help employers understand what their claims experience means for their options. The ladder has four rungs, and where you sit determines what becomes available to you.
| Loss Ratio Tier | What It Means | Funding Options Available |
|---|---|---|
| Below 70% | Exceptionally healthy group. Claims are well below premiums paid. You are significantly subsidizing the broader risk pool. | All options: fully-covered, level-funded, self-funded, Taft-Hartley multiemployer, captive arrangements, direct primary care overlays |
| 70% to 85% | Favorable experience. Claims are in line with or below what a well-managed plan would expect. Renewal leverage exists. | Level-funded plans, Taft-Hartley multiemployer plans, partially self-funded with stop-loss, PEO-sponsored plans |
| 85% to 100% | Average to high experience. The carrier is pricing your renewal conservatively. Alternative funding requires more scrutiny of claims drivers. | Modified fully-covered (plan design changes), some level-funded options with tighter stop-loss, plan redesign strategies |
| Above 100% | Claims exceed premiums paid. The carrier is losing money on your group and will price accordingly. Immediate action needed. | Fully-covered plans only (with significant rate increases), plan design overhaul, high-risk claims management, possible carrier change |
A loss ratio below 70% is the most favorable position a mid-size employer can be in, and it is also the position where staying on a fully-covered plan represents the largest opportunity cost. You qualify for the best underwriting terms across every alternative funding category. The BLS Employer Costs for Employee Compensation data shows health benefit costs represent 7.5% to 9.2% of total compensation for private sector workers — at this tier, employers who shift to alternative funding typically see that percentage decrease by 1 to 2 points within the first two plan years.²
This is the tier where the 60-employee employer from our opening example sits. An 83% loss ratio is favorable. The carrier is collecting more in premiums than it is paying in claims. A 9% renewal increase — which would be the standard outcome if the employer simply accepts the renewal — effectively means the carrier is profiting from that group's good health experience while simultaneously charging them more for it.
At this tier, the Loss Ratio Ladder opens several meaningful doors:
Level-funded plans allow the employer to pay a fixed monthly amount — similar to a fully-covered premium — that covers expected claims, stop-loss protection, and administrative fees. If actual claims come in below the expected amount, the employer receives a refund at year-end. For a group at 83% loss ratio, the level-funded premium is typically 8% to 15% lower than a comparable fully-covered rate, and the stop-loss feature protects against any catastrophic claim year.³
Taft-Hartley multiemployer plans are ERISA-governed trust funds that pool multiple employers and their workforces under a single benefit plan administered by a joint board of trustees. Originally designed for union labor agreements, these structures have evolved and certain multiemployer plans accept participation from qualifying non-union employers. The key qualification criterion is often favorable claims experience. A group at 83% loss ratio is precisely the kind of workforce a multiemployer plan wants to add to its pool. Employers who qualify can access negotiated provider rates comparable to large national employers — often 15% to 25% lower on hospital and specialty claims than standard commercial rates. For more on how this works, see our guide to how multiemployer plans offer better health coverage.
PEO-sponsored plans pool your workforce into a larger group under a Professional Employer Organization's master plan. PEOs aggregate hundreds or thousands of employees, which gives their plans negotiating power that a 60-person company cannot access independently. At a favorable loss ratio, your group's experience strengthens the PEO pool rather than burdening it, which often translates to better initial pricing.
In this range, claims are close to or exceeding what you are paying in premiums. Carriers are pricing your renewal to break even. Alternative funding is harder to access, but this is not a dead end. The strategic focus shifts from funding model changes to claims management: identifying whether cost drivers are pharmacy, specialist, out-of-network care, or concentrated in a few high-cost individuals. Targeted plan design changes at this tier can bring the loss ratio back into the 70% to 85% range within 12 to 24 months. It also means shopping the renewal aggressively — different carriers price the same risk differently, and employers who accept the first renewal number typically pay 7% to 12% more than those who get competing quotes. More on this in our piece on the hidden cost of renewing your group health plan without shopping.
A loss ratio above 100% means your group's claims exceeded premiums collected. Most alternative funding carriers will not underwrite a group at this tier without stop-loss adjustments that eliminate the cost benefit. The immediate priority is stabilization: understanding what drove the high-loss year, making plan design changes to manage ongoing cost drivers, and working with carriers who will underwrite the group at a workable rate while you bring the number down. Loss ratio tiers are not permanent — a group at 105% one year can return to 82% the next if the high-cost claims were acute events. The two-to-three year trend matters more than any single year.
Taft-Hartley multiemployer health plans are ERISA-governed trust funds administered by joint boards of employer and employee trustees. Established under the Labor Management Relations Act of 1947, they have operated for decades as the primary source of health coverage for union workers in construction, entertainment, and transportation. What most mid-market employers do not know is that certain multiemployer plans have expanded to include qualifying non-union employers — and favorable claims experience is often the primary admission criterion.
Qualifying typically requires documented claims experience over the prior 12 to 24 months (commonly a loss ratio in the 70% to 85% range), stable workforce demographics, and consistent participation. An employer with an 83% loss ratio and 50 to 75 employees is precisely the kind of group these plans want to add to their pool.
The financial case: large multiemployer plans negotiate hospital and physician rates at scale — sometimes 20% to 30% below what a standard commercial plan can access. They typically include prescription drug benefits, behavioral health coverage, and preventive care programs that mid-size employers struggle to fund independently. The administrative structure is handled by the trust, reducing HR overhead significantly. They are not the right fit for every employer — eligibility requirements, geographic reach, and benefit design constraints vary by trust — but for groups that qualify, they offer enterprise-quality coverage at a cost structure a 60-person company cannot build on its own.
If a favorable loss ratio unlocks better options, why do most employers with good claims experience end up simply renewing their fully-covered plan year after year at 7% to 10% annual increases? Three reasons: broker compensation structure, inertia, and data access.
Brokers compensated as a percentage of premium have a structural incentive to keep groups on fully-covered plans, where their compensation grows with each renewal increase. Alternative funding arrangements often involve lower or differently-structured broker compensation, which reduces the financial motivation to present them. Inertia compounds this — changing health plans is disruptive, and the cost of staying is invisible (it compounds in the budget) while the cost of changing feels immediate. And without your loss ratio data in front of you, the conversation never starts. According to KFF, the average annual health plan cost per covered worker has increased 47% over the past decade.¹ Employers who use their claims data as leverage consistently outperform those who do not.
If you do not know your group's loss ratio, start by emailing your broker and asking for three things: total claims paid over the last 12 months, total premiums paid over the same period, and the resulting loss ratio. Ask for a breakdown by category — medical, pharmacy, out-of-network — so you can see exactly where costs are concentrated. Place yourself on the Loss Ratio Ladder. If you are below 85%, schedule a conversation specifically about alternative funding options and bring your loss ratio documentation to that meeting. If you are above 85%, focus on claims drivers and plan design changes that can move your ratio into the favorable range over the next 12 to 18 months.
Before signing any renewal, model the cost trajectory under different funding strategies. A level-funded arrangement for a 60-person group at 83% loss ratio might cost $30,000 to $60,000 less per year than a fully-covered renewal. Compounded over six years against 8% to 10% annual increases on a fully-covered plan, the difference can reach $400,000 or more in total spend. That is not a rounding error. It deserves a real analysis before the paperwork is signed.
Model Your Renewal Scenarios
Use the Premium Renewal Stress Test to see how your loss ratio affects what you pay over the next 6 years — across 5 different funding strategies. No login required. No email gate. Free.
For mid-size employers on fully-covered plans, a loss ratio between 70% and 85% is considered favorable. Below 70% is exceptional and represents the strongest leverage position for alternative funding. Above 85%, carriers are pricing your renewal to break even or ahead of claims trend, and increases tend to be more significant. The KFF Employer Health Benefits Survey reports average loss ratios for employer-sponsored plans run between 80% and 88%.¹ Self-funded and level-funded plans typically reflect lower effective loss ratios because the employer captures favorable experience directly rather than leaving it with the carrier.
Ask your broker for your Annual Claims Experience Report or Group Loss Ratio Summary. This document is produced by your carrier at renewal and routinely shared with brokers. If your broker cannot provide it within a few business days, contact your carrier's group account service team directly with your group number and request the report as plan sponsor. For self-funded and level-funded plans, your TPA produces a monthly claims report that includes loss ratio data on an ongoing basis.
A Taft-Hartley multiemployer plan is an ERISA-governed health trust fund that pools multiple employers under a single benefit plan administered by a joint board of trustees. Originally designed for union labor agreements, certain multiemployer plans have expanded to accept qualifying non-union employers. Typical qualification criteria include a favorable loss ratio over the prior 12 to 24 months, stable workforce demographics, and a minimum employee count (usually 25 to 50 employees). The benefit of qualifying is access to provider networks and benefit structures that are typically only available to large national employers. Qualification requirements vary by plan — consult a benefits advisor who works specifically with Taft-Hartley arrangements to assess your group's eligibility.
No. Level-funded plans provide the same categories of medical, prescription, and preventive coverage that employees are accustomed to on a fully-covered plan. The difference is on the employer side: instead of the carrier taking all the risk, the employer funds claims up to a specific stop-loss threshold, and the carrier's stop-loss policy covers any claims above that amount. From the employee's perspective, the plan cards, provider networks, and benefit structures are largely unchanged. The employer's financial experience changes — for better in good years, with stop-loss protection in high-claims years.
Not necessarily. Underwriters for level-funded and self-funded arrangements are accustomed to evaluating loss ratios that include large individual claims. They typically normalize your data by excluding claims above a certain threshold — often $50,000 or $100,000 per individual — to produce what is called a normalized or adjusted loss ratio. If one catastrophic event (a premature birth, a cancer diagnosis, an accident) drove your loss ratio above 100% in a year when your underlying group was otherwise healthy, the normalized loss ratio will reflect that. Present your broker with both numbers and ask them to shop the plan with carriers who specialize in level-funded underwriting for groups with one-time large claims history.
The timeline depends on the funding model. Level-funded plan transitions typically take 60 to 90 days from the decision to implement — carriers need time to underwrite the group, set stop-loss thresholds, and produce enrollment materials. Taft-Hartley multiemployer plans often have specific enrollment windows (typically aligned with January 1 or July 1 plan years) and require 90 to 120 days lead time for the trust's eligibility review process. The best approach is to start the conversation at least six months before your current plan's renewal date, which gives you enough runway to evaluate all options and implement the best one without a coverage gap.
This article is provided for educational purposes and does not constitute financial, legal, or tax advice. Consult your benefits advisor and compliance counsel for guidance specific to your situation.
Sam Newland, CFP® is the founder and president of PEO4YOU and Business Insurance Health. With 13+ years in employee benefits — and a track record as the #1 face-to-face health plan agent nationally — Sam built PEO4YOU on a single principle: employers deserve to see exactly what they're paying for and why. Contact: [email protected] | 857-255-9394 | peo4you.com
April 19, 2026

April 19, 2026
April 20, 2026
April 20, 2026
Recent Posts
April 20, 2026
April 20, 2026
April 19, 2026
April 19, 2026

April 18, 2026

April 18, 2026
Get In Touch— We’re available 24/7
"*" indicates required fields
“We respect your privacy. Your contact information will be used solely for the purpose of responding to your inquiry and will not be shared with third parties.”
Click To Open Modal
Get In Touch— We’re available 24/7
"*" indicates required fields
“We respect your privacy. Your contact information will be used solely for the purpose of responding to your inquiry and will not be shared with third parties.”
Thanks!
We will be in touch soon.
If you're looking to book a consultation now
Affordable health and benefits plans for small businesses, freelancers, and independent contractors.

Copyright © 2026. Peo4you. All rights reserved.