

Every spring, when it's time to renew your health coverage, you probably get a call from your broker with a number. Maybe it's 8%. Maybe 12%. The broker explains it away as "industry trend" or "medical cost inflation," presents a few plan options, and waits for you to choose the one that stings least. You sign, you move on, and the cycle repeats next year.
Here's what almost never happens in that meeting: someone pulls your actual claims data, calculates your loss ratio, and explains what it means for your negotiating position. For most mid-size employers, that number — the ratio of what your employees actually spent on healthcare versus what you paid in premiums — is sitting inside an annual report that nobody reads. Or if they read it, nobody acts on it.
After reviewing the claims reports for dozens of employer groups over the past year, we've found a pattern that should frustrate any business owner who cares about where their money goes. Some employers are overpaying by tens of thousands of dollars annually — not because their employees are sick, but because their employees are healthy, and nobody has shown them how to use that as leverage.
The typical group health renewal process has been running the same way for decades. Your broker receives a rate proposal from the carrier, packages it into a comparison document, and presents it at a meeting — usually 30 to 60 days before your renewal date. There might be a new plan option to discuss. There's almost never a conversation about your group's actual claims experience.
This feels normal because it's been repeated millions of times. But it skips the most important question: what was the actual relationship between what your group paid in premiums and what it used in medical claims? That answer lives in your claims experience report — a document most employers either never request, receive in an unreadable format, or hand off to a broker who files it away.
The employers who do read their claims reports — and act on them — consistently find better options. The ones who don't keep renewing at whatever rate the carrier sets, year after year.
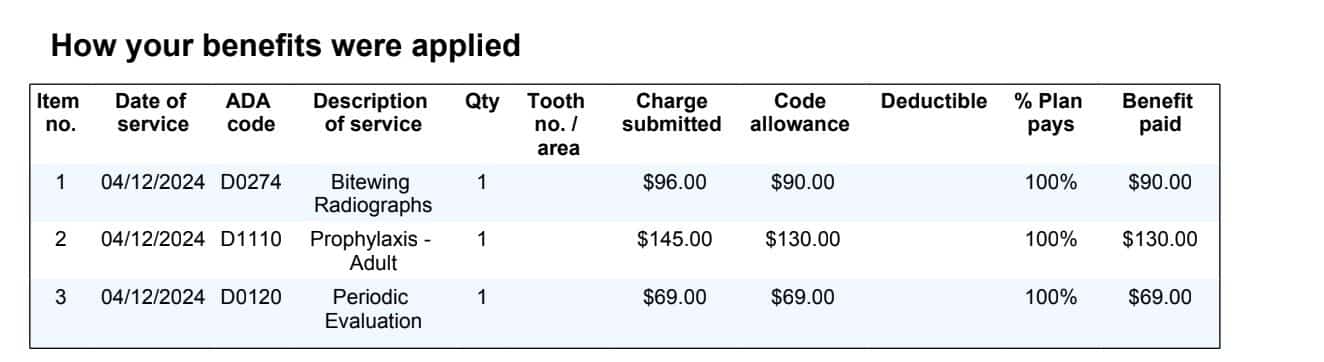
A standard carrier claims report includes total premium collected, total medical claims paid on behalf of covered members, a breakdown by claim type (inpatient, outpatient, pharmacy, behavioral health), member counts by month, and a summary of large individual claims — often anonymized, but visible by cost. From those numbers, you can calculate your incurred loss ratio: total claims divided by total premium. This single calculation tells you more about your group's actual risk profile than any benchmark your broker shows you.
A loss ratio of 85% means 85 cents of every premium dollar went toward actual medical care. The remaining 15 cents covered carrier overhead, administrative costs, and profit. The Affordable Care Act's Medical Loss Ratio (MLR) rule requires commercial carriers to spend at least 85% of premiums on medical care for large groups — and at least 80% for small groups — or issue rebates to employers.1 Many employers receive small MLR rebate checks each year without understanding what they represent: the carrier returned excess profit because it exceeded regulatory limits.
Groups with younger or healthier workforces often run loss ratios well below 85%. A group spending only 62 cents of every premium dollar on actual claims is, from the carrier's perspective, a highly profitable account. The carrier earned a 38-cent margin on your business that year. In the fully insured model, that margin stays with the carrier — regardless of how consistently your group performs.
Consider the situation a 75-employee technology services company found themselves in recently. Over a 12-month period, they paid approximately $647,000 in total premiums. Their actual medical claims were approximately $540,000 — a loss ratio of roughly 83%. The carrier netted over $100,000 in margin from this single group account.
At renewal, they received an 8% rate increase. The justification: "industry trend" and "plan design costs." Nobody mentioned that their group had generated significant carrier profit the prior year. Nobody offered a credit. Nobody suggested their favorable claims history gave them leverage to shop different funding arrangements. They renewed — because that's what most employers do.
We call this The Profitable Plan Trap: when a group's consistently favorable claims history produces no renewal credit and no surplus return, because they're in a fully pooled, fully insured arrangement where all financial upside belongs to the carrier. The employer carries the reputation risk of being a "good account" but captures none of the financial reward.
In a fully insured plan, the carrier pools your group with thousands of others across its book of business. When renewal time arrives, your individual claims experience may be partially weighted into your specific rate — but it's blended with pool-wide experience from groups with much higher claims. A favorable year for your group might reduce your increase by a percentage point or two. It almost never generates a credit or a refund.
This design is intentional. Carriers need premium stability across their entire book of business. They can't let every profitable group exit to alternative arrangements at renewal — that would concentrate higher-cost groups in the pool, driving up rates for everyone who stays. So they retain profitable accounts by raising rates modestly and consistently, rather than crediting the surplus back.
The result: your favorable claims history makes you a valuable customer for the carrier, but you personally capture almost none of that value.
Even groups with strong claims histories often see annual increases of 6-12%, compounding year over year. According to the Kaiser Family Foundation's 2024 Employer Health Benefits Survey, average employer-sponsored family premiums increased 7% in 2024 alone, and have risen 24% over the past five years.2 For groups with consistently below-average claims, those increases reflect pool-wide pricing pressure — not growth in their own workforce's healthcare use.
A group that started at $600 per employee per month five years ago might now be paying $760 or more — even if their actual per-employee claims have stayed flat. That's the ratchet effect: annual increases that never fully reset, applied regardless of individual group performance.
If your group consistently runs a favorable loss ratio, you have access to funding arrangements that weren't practical — or weren't accessible — for small and mid-size employers even five years ago. Each carries different tradeoffs, but all share a common feature: your claims history works for you, not for the carrier.
A level-funded plan operates like a self-funded arrangement with a fixed monthly payment. You pay a set amount that covers expected claims, stop-loss protection, and administration. At year end, if actual claims were lower than projected, you receive a surplus refund — typically 50-100% of the unused claims fund, depending on plan design.3
For employers with consistent, favorable claims histories, level-funded plans often deliver effective savings of 10-20% compared to fully insured premiums, plus the surplus return at year end. The tradeoff: you carry more claims risk. Stop-loss coverage — which reimburses catastrophic claims above a set per-person threshold — is bundled into the plan to cap that exposure. For groups with stable, predictable claims, the stop-loss cost is typically modest relative to the savings opportunity.
One funding option that rarely appears in a standard broker's comparison is the multiemployer trust plan — also called a Taft-Hartley trust. These plans pool risk across unrelated employers through a nonprofit trust structure. Because the trust is not a commercial carrier, there are no carrier profit margins built into the premium. Administrative overhead ratios in multiemployer trusts typically run 10-15%, compared to 15-25% for commercial carriers.4
For groups with 20-200 employees and favorable claims histories, multiemployer trust plans can offer renewal increases significantly below the commercial market — often in the 2-5% range versus the 8-15% typical of fully insured renewals. Your group's performance builds equity in the trust over time, rather than generating carrier profit that disappears at year end.
Groups we've helped transition into multiemployer trust arrangements — when their loss ratio and group profile qualified them — have seen first-year premium reductions in the range of 12-22%, with meaningfully better renewal stability in subsequent years.† These are not universal outcomes, and qualification depends on group size, claims history, and trust requirements. But for the right profile, the economics are compelling.
† BIH client analysis, internal data. Individual results vary based on group claims history, size, and plan design.
In a fully self-funded arrangement, the employer assumes direct financial responsibility for claims, with stop-loss coverage protecting against catastrophic individual or aggregate claim events. Every premium dollar is allocated to actual claims, administration, or stop-loss — there's no carrier profit margin embedded in the structure.
Self-funding is the most transparent option and, for groups with 50+ employees and consistently favorable claims histories, can reduce effective health plan costs by 15-30% compared to fully insured alternatives.5 The tradeoff is claims volatility: a single high-cost claimant can create a significant budget impact in a given year. That's why stop-loss design — choosing the right attachment point — is critical to making self-funding work without unacceptable financial exposure.
Ask your broker or your carrier directly for your annual claims experience report. You are entitled to this data as the plan sponsor. If your broker has never proactively provided this — or if they discourage you from looking at it — that's important information about how your relationship is structured.
Request these specific figures:
The calculation is straightforward:
Loss Ratio = Total Incurred Claims ÷ Total Premium Collected
Using the example from earlier: $540,000 in claims ÷ $647,000 in premiums = 83.5% loss ratio.
Interpreting the result:
A single-year loss ratio can be misleading — one high-cost claimant can swing a group from 65% to 130% in a single plan year. Whenever possible, review three years of data. A group averaging 68% over three consecutive years has a fundamentally different set of options than a group that ran at 65% once and 95% the other two years. The multi-year trend is what underwriters use to evaluate your group — use it the same way when evaluating your own options.
Model Your Health Plan Funding Options
Use the Health Funding Projector — free, no login, no email gate. Compare 7 funding arrangements side by side, including multiemployer trust plans, to see which structure fits your group's claims profile and headcount.
Like this tool? We built five more just like it — all free, all ungated. Explore all tools at PEO4YOU →
For a fully insured group plan, a loss ratio between 80-90% means your claims roughly match your premiums — you're not a highly profitable account for the carrier, but you're also not being subsidized by the pool. A ratio consistently below 75% is a strong indicator that you're overpaying relative to your group's actual healthcare use, and alternative funding arrangements are likely worth exploring. Ratios below 65% sustained over multiple years almost always justify a formal evaluation of level-funded, multiemployer trust, or self-funded options.
In a fully insured plan, your negotiating leverage is limited. Carriers can adjust individual group rates based on experience, but they blend your data with pool-wide performance — reducing the impact of your favorable history on your specific rate. Your real leverage comes from being willing to genuinely explore alternative funding arrangements. When a carrier knows you have a viable alternative quote and the willingness to act on it, renewal negotiations look very different. A broker who only shops the fully insured market limits your leverage before the conversation even starts.
A multiemployer trust — sometimes called a Taft-Hartley trust — is a nonprofit pool of employers who collectively fund their health benefits through a trust structure governed by a board of trustees. Because the trust has no profit motive, every premium dollar goes toward claims, administration, or reserves — not carrier margins. Renewal increases are tied to actual trust claims experience, not commercial market pricing cycles. For employers with 20-200 employees and favorable claims histories, these plans frequently offer better pricing and more predictable renewals than commercial fully insured alternatives. Not every employer qualifies, but it's worth understanding the eligibility criteria for your group size and industry.
At minimum, annually — and ideally 90 days before your renewal date, so you have time to use the data as leverage or run alternative quotes before the carrier assumes you're renewing. Even better: request a mid-year claims review 6 months into your plan year. If a high-cost claimant has emerged, you can start planning. If your experience is tracking well below projections, you can proactively approach your broker about the renewal strategy well in advance. Employers who review claims data twice per year consistently get better renewal outcomes than those who engage only at renewal time.
Not necessarily — but it significantly changes the underwriting conversation. Most level-funded carriers will price around a known high-cost condition rather than exclude the employee. The stop-loss attachment point (the per-person threshold above which the insurer takes over the claim) will typically be set lower, increasing the stop-loss component of your premium. In some cases, the overall economics still favor level-funded over fully insured — especially if the rest of your group has favorable claims. The only way to know is to get actual quotes with the condition disclosed. A good advisor will run both scenarios and show you the math.
Start by requesting your annual claims experience report from your current carrier. Calculate your 12-month loss ratio using the formula above — claims divided by premium. If it's consistently below 80%, bring that data to your next broker meeting and ask specifically: "What funding alternatives have you quoted for a group with our loss ratio history?" If the answer is "we only work with fully insured plans," that's your signal to get a second opinion. You can also use the Health Funding Projector at peo4you.com/health-funding-projector to model what different funding arrangements might look like for a group with your profile.
This analysis is provided for educational purposes and does not constitute financial or legal advice. Consult your compliance counsel and benefits advisor for guidance specific to your organization's situation.
Sam Newland, CFP®, is the founder and president of PEO4YOU and Business Insurance Health. With more than 13 years in employee benefits and a background as a nationally ranked benefits advisor, Sam built PEO4YOU to give mid-size employers the same market access and transparency previously available only to large corporations. Contact: [email protected] | 857-255-9394
April 20, 2026

April 20, 2026
April 18, 2026
April 18, 2026
Recent Posts
April 20, 2026
April 20, 2026
April 18, 2026
April 18, 2026

April 18, 2026

April 18, 2026
Get In Touch— We’re available 24/7
"*" indicates required fields
“We respect your privacy. Your contact information will be used solely for the purpose of responding to your inquiry and will not be shared with third parties.”
Click To Open Modal
Get In Touch— We’re available 24/7
"*" indicates required fields
“We respect your privacy. Your contact information will be used solely for the purpose of responding to your inquiry and will not be shared with third parties.”
Thanks!
We will be in touch soon.
If you're looking to book a consultation now
Affordable health and benefits plans for small businesses, freelancers, and independent contractors.

Copyright © 2026. Peo4you. All rights reserved.