

A 100-employee mid-size employer that stays fully insured will pay approximately $1.7 million more in cumulative health insurance premiums over 10 years than an identical employer that switches to self-funded, captive, or PEO-based benefits in Year 1.
American mid-size employers face an unprecedented convergence of economic forces. First, fully insured health insurance premiums have entered a compounding spiral. The Kaiser Family Foundation's 2025 Employer Health Benefits Survey revealed that family premiums rose 6% annually for three consecutive years -- the first time this has occurred in 20 years. Mercer projects a 6.5% increase for 2026, the highest since 2010, and notes that without employer intervention, increases could reach 9%. Aon forecasts 9.5% growth, pushing per-employee costs above $17,000. For small groups, the Peterson-KFF Foundation reports proposed median increases of 11%, with the Society for Human Resource Management and International Foundation of Employee Benefit Plans tracking organizations projecting 10% health cost hikes in 2026.
Over the past five years alone, family premiums have risen 26% -- outpacing wage growth by a factor of three. This trajectory is unsustainable for employers of any size.
The second crisis is an information and adoption gap. Although 67% of all covered workers in the United States are already enrolled in self-funded plans, only 27% of workers at firms with 10-199 employees -- the heart of the mid-market -- participate in such arrangements. Simultaneously, level-funded plans cover 37% of workers at small-to-mid-size firms, and over 40% of employers are actively using or considering captive insurance programs. Yet most brokers, HR consultants, and benefits advisors continue to default to fully insured renewals, often without presenting the financial case for alternatives.
The result: thousands of employers renew at 7%, 8%, 9%, or 10% annually, unaware that a different funding model could stabilize costs at 3%, 4%, or even 2% growth -- a gap that compounds into catastrophic long-term cost differences.
To quantify the financial impact, we modeled a representative 100-employee mid-size employer with the following baseline characteristics:
We then projected two divergent paths over 10 years:
Scenario A: Stay Fully Insured at 7.5% annual increase (midpoint of KFF historical 6% and Mercer/Aon forward projections of 9-9.5%).
Scenario B: Switch to Alternative Funding at 3.5% annual increase, plus an 8% one-time base reduction in Year 1 from eliminating carrier profit margins and admin costs.
| Year | Fully Insured (7.5%) | Alternative (3.5%) | Annual Gap | Cumulative Gap |
|---|---|---|---|---|
| 0 (Baseline) | $1,447,810 | $1,447,810 | $0 | $0 |
| 1 | $1,556,396 | $1,331,985* | $224,411 | $224,411 |
| 2 | $1,673,125 | $1,378,604 | $294,521 | $518,932 |
| 3 | $1,798,610 | $1,426,855 | $371,755 | $890,687 |
| 4 | $1,933,506 | $1,476,795 | $456,711 | $1,347,398 |
| 5 | $2,078,519 | $1,528,483 | $550,036 | $1,897,434 |
| 6 | $2,234,408 | $1,581,980 | $652,428 | $2,549,862 |
| 7 | $2,401,989 | $1,637,349 | $764,640 | $3,314,502 |
| 8 | $2,582,138 | $1,694,656 | $887,482 | $4,201,984 |
| 9 | $2,775,798 | $1,753,969 | $1,021,829 | $5,223,813 |
| 10 | $2,983,983 | $1,815,358 | $1,168,625 | $6,392,438 |
*Year 1 alternative base reflects 8% reduction from eliminating carrier profit margins, premium taxes, and admin overhead.
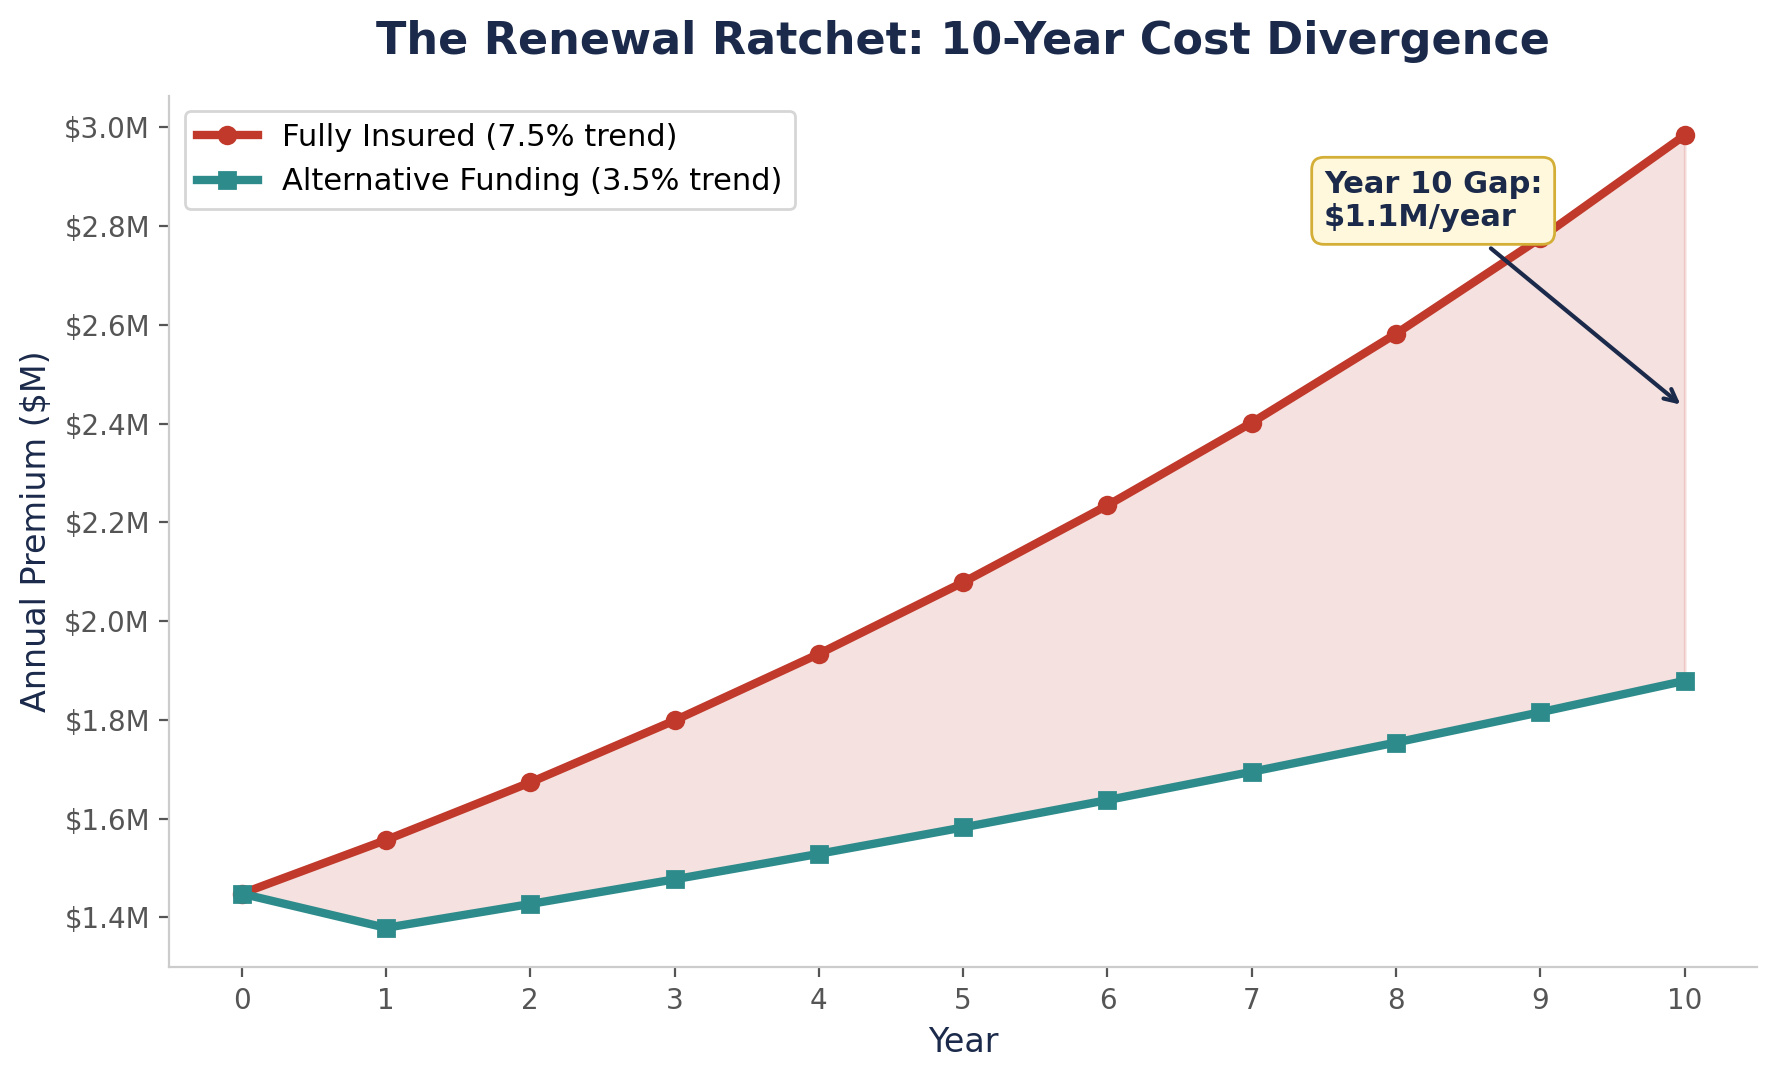
The fully insured employer accumulates $21.8 million in cumulative health costs over 10 years. The alternative-funded employer accumulates $16.1 million -- a cumulative gap that reaches $1.7 million by Year 5 and balloons to $6.4 million by Year 10. Even at the conservative 5-year mark, the gap exceeds $1.9 million.

The performance gap reflects structural cost advantages inherent in alternative funding:
Self-funded plans eliminate 2-3% in state premium taxes, 3-8% in carrier profit margins, and 1-2% in administrative overhead -- savings totaling 6-13% in base cost. For a $1.4M annual premium, this translates to $84,000-$182,000 in immediate Year 1 savings.
Captive insurance consortiums pool risk across multiple employers, improving predictability and negotiating power. Willis Towers Watson reports that over 40% of employers are now using or considering captive structures, with demonstrated trend rates 1-2 percentage points below fully insured markets.
PEOs and Taft-Hartley plans spread risk across thousands of employees, reducing volatility and enabling economies of scale that traditional group insurance cannot match.
Level-funded plans offer a hybrid: full insurance protections for catastrophic claims while returning surplus premium at year-end, indexing cost increases to actual claims rather than broad market trends.
Situation: Tailored Industry, Inc., a clothing manufacturer in Brooklyn, NY with approximately 30 employees, was fully insured through UHC Oxford on a Gold-tier EPO plan. Their 2024 renewal came in at a 5.91% medical increase -- pushing employee-only premiums to $1,310/month for medical alone, plus $68/month for dental (separate policy). No vision, life, or accident coverage was included. With the New York DFS approving average small group increases of 8.4% for 2025 and 13% for 2026, the company faced a projected 22.5% cumulative increase over two years on top of an already expensive plan -- and that was just medical.
Strategy: PEO enrollment via PEO4YOU, effective September 1, 2024. Transitioned from NY small group fully insured (UHC Oxford EPO Gold) to PEO-based BCBS PPO with bundled ancillary benefits. No payroll change required, no medical underwriting. Plan renewed 1/1/2025 and 1/1/2026 with near-flat increases.
Result: Within 18 months of switching to PEO4YOU, Tailored Industry saved an estimated $147,000+ in total group costs compared to their projected fully insured trajectory. Their 2026 medical-only increase was just 2% -- versus the 13% NY statewide average and 11.8% Oxford-specific approved increase. Better yet, their total per-employee cost of $985/month now includes medical (BCBS PPO -- a larger network than their old Oxford EPO), dental, vision, life, and accident coverage. Their old plan at $1,378/month covered only medical and dental.
| Period | PEO4YOU Total (EE) | Projected UHC Oxford (med+dental) | Monthly Savings | PEO Includes |
|---|---|---|---|---|
| Sep 2024 (switch) | $938/mo | $1,378/mo | $440/mo | Med + Dental + Vision + Life + Accident |
| Jan 2025 (1st renewal) | $938/mo (~0%) | $1,451/mo (+5.3%) | $513/mo | Full package |
| Jan 2026 (2nd renewal) | $985/mo (+2% medical) | $1,617/mo (+11.8%) | $632/mo | Full package |
UHC Oxford projected rates based on DFS-approved small group increases: 5.3% (2025) and 11.8% (2026) for Oxford Health Insurance specifically. PEO4YOU rates include H&W (BCBS PPO), dental, vision, $10K life, accident, admin, and union fees. Sources: NY DFS 2025 and 2026 approved rate filings; PEO4YOU rate cards.
"Without changing payroll or going through underwriting, we saved over 50% on our medical plan while upgrading to a PPO, improving benefits, and reducing expected renewal increases. The savings allowed us to add dental and vision coverage and hire a new full-time employee to support our business growth."
-- Alex & Kady Tschopp, Co-Founders, Tailored Industry
Implementation typically costs $15,000-$40,000 for a 100-employee firm (consulting, actuarial analysis, stop-loss placement). Even at the high end, a $40,000 investment is recouped in the first year.
| Strategy | Annual Trend | 3-Year Savings | 5-Year Savings | 10-Year Savings |
|---|---|---|---|---|
| Self-Funded (conservative) | 3.5% | $532,500 | $894,000 | $1,694,000 |
| Level-Funded | 3.0% | $587,000 | $986,000 | $1,847,000 |
| PEO (via PEO4YOU) | 3.5% | $506,000 | $851,000 | $1,612,000 |
| Captive Consortium | 3.2% | $621,000 | $1,042,000 | $1,925,000 |
| Taft-Hartley Trust | 2.5% | $742,000 | $1,235,000 | $2,314,000 |
Savings are cumulative vs. staying fully insured at 7.5% trend. Actual results vary by claims history, group size, and market.
| Metric | Construction | Impact |
|---|---|---|
| Average wage per employee | $58,360 | +$8,860 above national median |
| Occupational injury rate | 4.1 per 100 (OSHA) | Above-average claims cost |
| Typical fully insured trend | 8-9% | +0.5-1.5 pts vs. baseline |
| Self-funded penetration | ~14% | Very low; high opportunity |
Construction firms face steeper fully insured penalties due to above-average claims costs from occupational injuries. A 100-person contractor at 8.5% annual trend would face $2.1M in excess costs by Year 10 versus an alternative-funded peer. Captive consortiums specializing in construction have demonstrated 2.5 percentage points below fully insured trends.
| Metric | Manufacturing | Impact |
|---|---|---|
| Average wage per employee | $45,960 | Below national median |
| Occupational injury rate | 3.8 per 100 | Moderate claims environment |
| Typical fully insured trend | 7-8% | Near baseline |
| Self-funded penetration | ~32% | Above average for mid-size |
Manufacturing mid-market employers lead in alternative funding adoption at 32% self-funded, yet 68% remain fully insured. Those still on fully insured plans face a $1.6-$1.8M cumulative penalty by Year 10.
| Metric | Transportation | Impact |
|---|---|---|
| Average wage per employee | $42,740 | Lowest among target sectors |
| Occupational injury rate | 5.2 per 100 (OSHA) | Highest among target sectors |
| Typical fully insured trend | 9-10% | +1.5-2.5 pts vs. baseline |
| Self-funded penetration | ~19% | Low adoption; highest opportunity |
Transportation faces the steepest headwinds: highest injury rates, lowest wages, and the highest fully insured trends. A 100-person fleet at 9.5% trend accumulates $2.3M in excess costs over 10 years. Level-funded and PEO strategies are particularly well-suited, protecting against catastrophic claims while lowering trends by 2-3 percentage points.
If the $1.7M penalty is so clear, why do most brokers default to fully insured renewals?
The answer is structural: most brokers earn commissions tied to premium volume. A 5-8% commission on a $1.5M fully insured renewal generates $75,000-$120,000 in annual broker revenue. Moving to alternative funding that saves the employer $200,000-$400,000 simultaneously reduces broker commissions by $10,000-$32,000 per year.
Additionally, many brokers lack expertise in alternative funding. Building a captive or designing a self-funded program requires specialized actuarial, regulatory, and claims administration knowledge. It is often easier -- and more profitable -- to renew the existing fully insured plan.
Employers must proactively seek out benefits consultants who are compensated on a fee basis rather than premium commission, and who have demonstrated expertise in self-funded, level-funded, captive, PEO, and Taft-Hartley programs.
Assumptions: (1) Fully insured trend 7.5% annually. (2) Alternative funding trend 3.5%. (3) One-time 8% base reduction Year 1. (4) 70% participation, 45 family/25 single split. (5) No material plan design changes. (6) Captive/Taft-Hartley at 2.5-3.2% trend. Actual results vary by group size, claims experience, geography, and plan design. This analysis is provided for educational purposes and does not constitute financial, legal, or benefits consultation advice.
About the Author: Sam Newland, CFP®, has spent 13+ years in the employee benefits industry and founded Business Insurance Health and PEO4YOU to bring transparency to an industry that profits from complexity. His approach is simple: show employers the real numbers and let them decide.
Recent Posts

March 10, 2026


March 9, 2026

March 9, 2026

March 5, 2026

March 4, 2026
March 3, 2026
Get In Touch— We’re available 24/7
"*" indicates required fields
“We respect your privacy. Your contact information will be used solely for the purpose of responding to your inquiry and will not be shared with third parties.”
Click To Open Modal
Get In Touch— We’re available 24/7
"*" indicates required fields
“We respect your privacy. Your contact information will be used solely for the purpose of responding to your inquiry and will not be shared with third parties.”
Thanks!
We will be in touch soon.
If you're looking to book a consultation now
Affordable health and benefits plans for small businesses, freelancers, and independent contractors.

Copyright © 2026. Peo4you. All rights reserved.