

A mid-size construction or manufacturing employer with 100 workers will absorb approximately $287,000 in additional GLP-1-driven premium costs over 3 years if they remain fully insured -- roughly 3x more per employee than a large self-funded employer with pharmacy carve-out capabilities.
American employers are facing a pharmaceutical cost shock unlike anything in recent memory. GLP-1 receptor agonists -- branded as Ozempic, Wegovy, Mounjaro, and Zepbound -- have become the fastest-growing drug class in employer-sponsored health plans, with individual patient costs ranging from $800 to $1,500+ per month. The Employee Benefit Research Institute (EBRI) projects that widespread GLP-1 utilization could increase employer health insurance premiums by 5.3% to 13.8%, depending on adoption rates.
The Kaiser Family Foundation's 2025 Employer Health Benefits Survey reports that 36% of large employers cite prescription drug prices as contributing "a great deal" to premium increases, while the Business Group on Health found that 79% of large employers are seeing increased GLP-1 utilization in their plans. Average family premiums have hit $26,993 -- a 6% increase for the third consecutive year, the first time this has occurred in two decades.
But here is where the crisis becomes asymmetric: large employers with self-funded plans can implement pharmacy carve-outs, formulary management, step therapy protocols, and direct GLP-1 manufacturer contracts to manage costs. Mid-size employers (30-200 employees) that remain fully insured have none of these tools. They absorb the full premium impact passed through by their carrier.
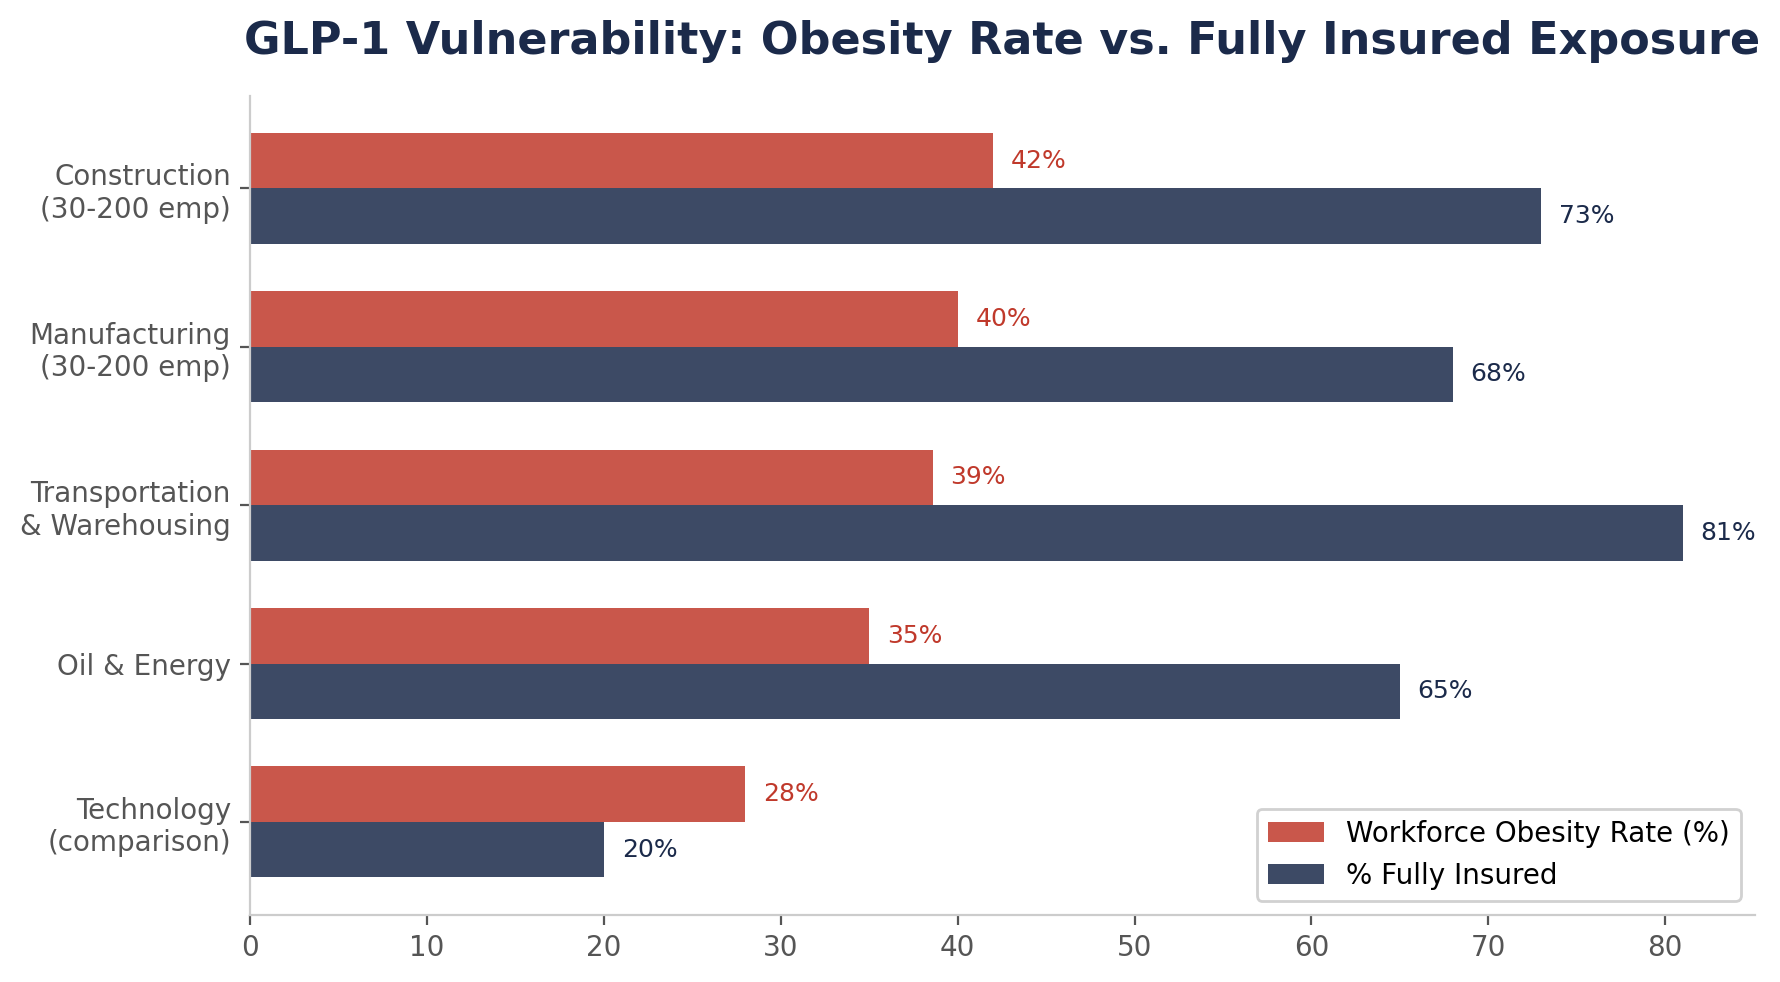
The second crisis magnifying this exposure is workforce composition. Blue-collar industries -- construction, manufacturing, transportation, and energy -- have workforces with higher obesity prevalence than the national average. CDC/NHANES data reports the national adult obesity rate at 41.9%. Workers in transportation and warehousing show obesity rates of 38.6%, and construction and manufacturing workers track at or above national averages. Higher obesity prevalence means higher GLP-1 demand, which means higher premium impact -- concentrated in the very industries least equipped to manage it.
To quantify which employers face the greatest GLP-1 cost exposure, we developed the GLP-1 Vulnerability Index -- a composite score based on four factors: workforce obesity prevalence, percentage of employees in fully insured plans, average premium cost, and projected GLP-1 utilization rate.
| Industry | Obesity Rate | % Fully Insured | Avg Family Premium | GLP-1 Vulnerability |
|---|---|---|---|---|
| Construction (30-200 employees) | ~42% | 73% | $26,993 | CRITICAL |
| Manufacturing (30-200 employees) | ~40% | 68% | $26,993 | CRITICAL |
| Transportation & Warehousing | 38.6% | 81% | $26,993 | CRITICAL |
| Oil & Energy | ~35% | 65% | $26,993 | HIGH |
| Technology (comparison) | ~28% | 20% | $26,993 | MODERATE |
| All Industries (large employers) | 41.9% | 33% | $26,993 | MODERATE |
Sources: CDC/NHANES (obesity); KFF 2025 EHBS (premiums, funding type); BIH analysis (vulnerability scoring). Fully insured percentage for mid-size firms estimated from KFF data showing 73% of workers at firms with 10-199 employees are NOT in self-funded plans.
Model Employer: 100-employee mid-size construction firm
| Metric | Fully Insured (No Carve-Out) | Self-Funded (With Pharmacy Carve-Out) |
|---|---|---|
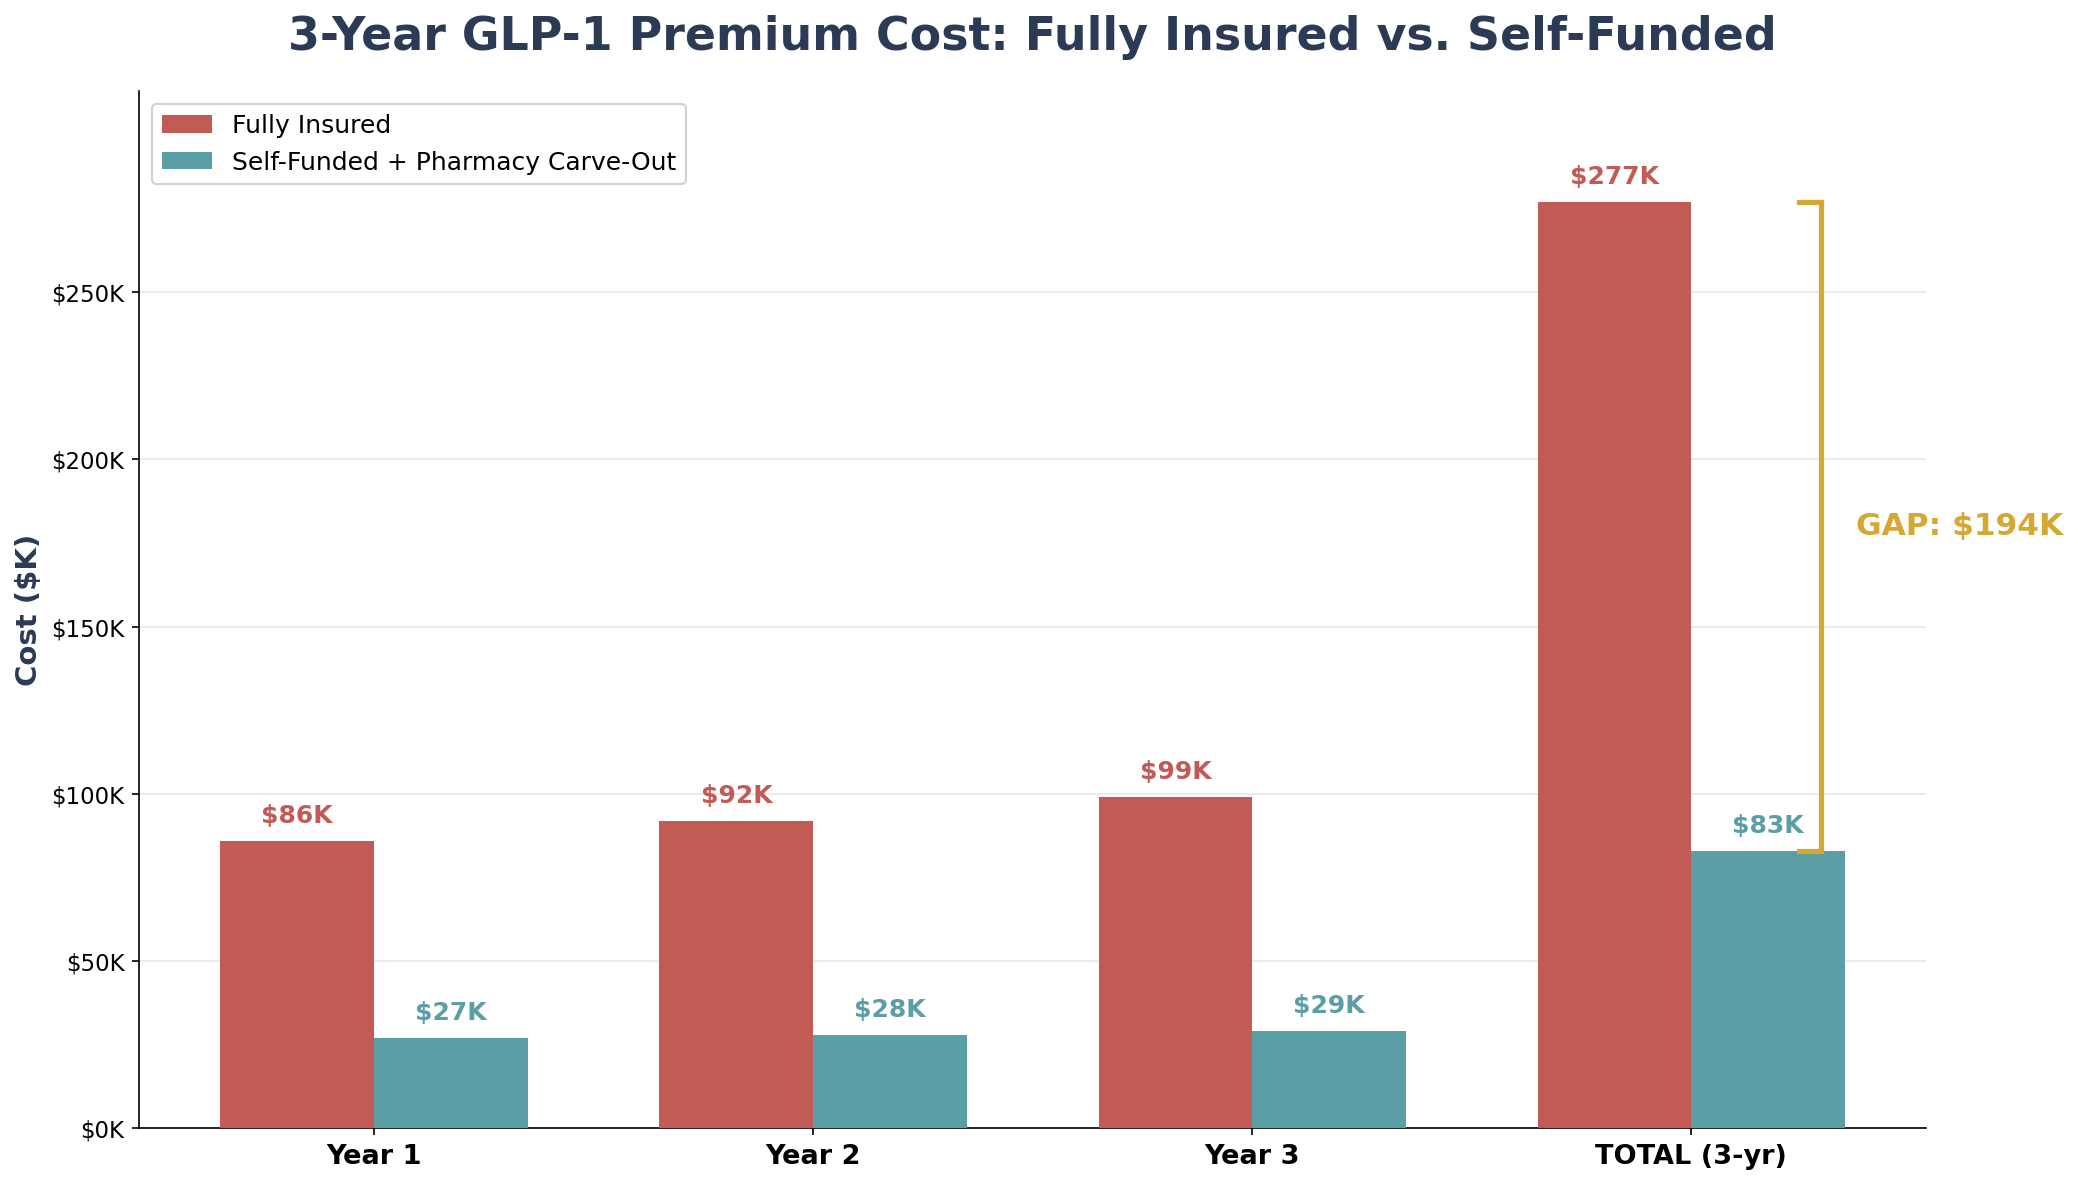
| GLP-1 premium impact (annual) | 8.0% ($85,710) | 2.5% ($26,785) |
| Year 1 additional cost | $85,710 | $26,785 |
| Year 2 (compounded at 7.5% / 3.5%) | $92,138 | $27,722 |
| Year 3 (compounded) | $99,048 | $28,693 |
| 3-Year cumulative GLP-1 cost | $276,896 | $83,200 |
| THE GAP (3 years) | $193,696 | -- |
| Total 3-yr cost difference (incl. base trend) | $287,000+ | -- |
The 8% mid-range GLP-1 impact is derived from EBRI's projected range of 5.3%-13.8%. The self-funded 2.5% impact reflects pharmacy carve-out, step therapy, and formulary management capabilities available to self-funded employers.
When you add the base premium trend differential (fully insured at 7.5% vs. alternative at 3.5%) to the GLP-1 surcharge, the fully insured mid-size employer accumulates approximately $287,000 more in total health costs over 3 years than an identical employer that moved to self-funded with pharmacy carve-out.
The 3x multiplier is not arbitrary. It reflects three compounding disadvantages:
First, fully insured carriers spread GLP-1 costs across their entire book of business, but mid-size group rates are more volatile than large group rates. Peterson-KFF reports that small group insurers are proposing median 11% premium increases for 2026, compared to 6% for large groups. GLP-1 costs amplify this disparity.
Second, fully insured mid-size employers cannot implement pharmacy carve-outs. In self-funded arrangements, employers can contract directly with PBMs, negotiate GLP-1 pricing, require step therapy (lifestyle modifications before drug coverage), and set formulary restrictions. Fully insured employers accept whatever the carrier decides.
Third, blue-collar workforces have higher baseline obesity rates, creating proportionally higher GLP-1 demand. A construction firm with 42% workforce obesity will see more GLP-1 utilization than a tech company with 28% -- and the fully insured construction firm has no tools to manage the cost.
Situation: Four Paws MA, a nonprofit animal welfare organization in Massachusetts, was enrolled in a health-based PEO using an Aetna medical plan. Their premium increases had been escalating dramatically: 13.8% in 2023, followed by a staggering 45.2% increase in 2024. Facing yet another 8.8% Aetna renewal for 2025, the organization's benefits budget was being consumed by compounding health insurance costs -- costs likely driven in part by rising pharmacy expenses including GLP-1 medications across their PEO's risk pool.
Strategy: PEO enrollment via PEO4YOU, effective September 2025. BCBS PPO medical plan replacing Aetna HMO/EPO, plus bundled dental, vision, life, and accident coverage.
Result: After switching to PEO4YOU in September 2025, Four Paws MA received a 2% medical increase for January 2026 -- compared to the double-digit increases they had experienced in each of the prior two years. Additionally, the organization gained comprehensive benefits (health, dental, vision, and life insurance) for approximately the same cost they had previously been paying for health coverage alone. The predictable, low-single-digit renewal allowed the nonprofit to redirect funds toward its mission.
| Year | Prior PEO (Aetna) | PEO4YOU | Difference |
|---|---|---|---|
| 2023 Renewal | +13.8% | -- | -- |
| 2024 Renewal | +45.2% | -- | -- |
| 2025 Renewal (facing) | +8.8% | Switched Sep 2025 | Avoided increase |
| 2026 Renewal | -- | +2.0% | vs. 13% MA avg |
Prior PEO carrier name withheld. PEO4YOU 2026 medical increase of 2% compares to the 13% statewide average approved by MA DFS for 2026 small group plans.
"Sam helped our nonprofit organization secure stronger coverage with a better carrier and expanded network while also somehow reducing costs -- which was a huge win for our organization and all of our employees."
-- Kevin MacDonald, HR Manager, Four Paws MA
Transitioning from fully insured to an alternative funding structure that includes pharmacy management typically costs $20,000-$45,000 for a 100-employee firm (consulting, actuarial analysis, stop-loss placement, employee communication). This investment is recovered in the first 3-6 months of operation.
| Strategy | GLP-1 Cost Management | 1-Year Savings | 3-Year Cumulative |
|---|---|---|---|
| Self-Funded + Pharmacy Carve-Out | Step therapy, formulary, PBM negotiation | $129,000 | $387,000 |
| Level-Funded + Rx Management | Carrier Rx formulary + surplus return | $95,000 | $285,000 |
| PEO (via PEO4YOU) | Pooled Rx purchasing, scale discounts | $108,000 | $324,000 |
| Captive Consortium | Shared Rx risk pool, custom formulary | $142,000 | $426,000 |
| Taft-Hartley Trust | Union-negotiated Rx terms, bulk purchasing | $158,000 | $474,000 |
Conservative estimates based on 8% GLP-1 premium impact for fully insured vs. 2-3% managed impact for alternative funding, plus base trend differential. Actual savings depend on claims experience, group demographics, and plan design.
| Metric | Value | Implication |
|---|---|---|
| Median wage (BLS 2024) | $58,360 | Higher wages = slightly lower benefits-to-wage ratio |
| Workforce obesity rate | ~42% | Above national average; high GLP-1 demand |
| % Fully insured (est.) | 73% | Minimal pharmacy management capability |
| 3-year GLP-1 premium bomb | $287,000+ | CRITICAL exposure level |
Construction firms face the highest GLP-1 vulnerability due to the combination of above-average obesity rates and very low self-funded adoption. A 100-person general contractor could save $387,000-$474,000 over 3 years by moving to self-funded or captive structures with pharmacy carve-outs.
| Metric | Value | Implication |
|---|---|---|
| Median wage (BLS 2024) | $45,960 | Lower wages amplify benefits cost burden |
| Workforce obesity rate | ~40% | Near national average; significant GLP-1 demand |
| % Fully insured (est.) | 68% | Higher self-funded adoption than construction |
| 3-year GLP-1 premium bomb | $265,000+ | HIGH exposure level |
Manufacturing has modestly higher self-funded adoption (32% vs. 27% overall for mid-size firms), but the majority remain fully insured and exposed. The lower median wage ($45,960) means the GLP-1 premium increase hits harder relative to total compensation.
| Metric | Value | Implication |
|---|---|---|
| Median wage (BLS 2024) | $42,740 | Lowest among target sectors |
| Workforce obesity rate | 38.6% | CDC-documented above average |
| % Fully insured (est.) | 81% | Very low self-funded penetration |
| 3-year GLP-1 premium bomb | $295,000+ | CRITICAL exposure level |
Transportation employers face the worst of both worlds: the lowest wages (making benefits the largest share of compensation), CDC-documented high obesity prevalence (38.6%), and the lowest self-funded penetration. PEO and Taft-Hartley structures are particularly suited to this sector, providing pooled pharmacy purchasing power.
| Metric | Value | Implication |
|---|---|---|
| Median wage (BLS 2024) | $62,400 | Highest among blue-collar sectors |
| Workforce obesity rate | ~35% | Moderate; field workers higher than office |
| % Fully insured (est.) | 65% | Some captive adoption in larger firms |
| 3-year GLP-1 premium bomb | $248,000+ | HIGH exposure level |
Oil and energy employers benefit from higher wages but still face significant GLP-1 exposure, particularly for field operations workers. Captive consortiums tailored to the energy sector have shown strong results in managing specialty drug costs.
If the GLP-1 premium bomb is this predictable, why aren't benefits brokers sounding the alarm?
The answer has three parts. First, most brokers earn commissions tied to premium volume -- higher premiums mean higher commissions. A $1.4M fully insured renewal generates $70,000-$112,000 in annual broker revenue at standard 5-8% commission rates. Moving to self-funded or PEO arrangements reduces premiums and, consequently, broker income.
Second, pharmacy carve-out design is a specialized skill. Building a self-funded program with PBM negotiation, formulary management, step therapy protocols, and stop-loss pharmacy aggregating factors requires actuarial and clinical expertise most retail brokers do not possess.
Third, many brokers simply don't model GLP-1 impact separately. They see a 10% renewal and negotiate it down to 8% without disaggregating the pharmacy component. A strategic benefits consultant would identify the GLP-1 driver, model alternative scenarios, and present the employer with funding options that specifically address pharmacy cost management.
All projections are based on the following assumptions: (1) GLP-1 premium impact of 8% for fully insured (mid-range of EBRI 5.3%-13.8% projection) and 2.5% for self-funded with pharmacy carve-out. (2) Base premium trend: 7.5% fully insured (midpoint of KFF historical 6% and Mercer/Aon forward projections 9-9.5%) and 3.5% alternative funding. (3) Model employer: 100 employees, 70% participation, 45 family/25 single split, 74% employer contribution. (4) Obesity prevalence by industry from CDC/NHANES, applied directionally (not as precise actuarial input). (5) Pharmacy carve-out savings assume PBM negotiation, step therapy, and formulary management reduce GLP-1 cost pass-through by 60-70%. (6) All savings projections are ranges, not point estimates. Actual results vary based on claims experience, group demographics, regional market conditions, and plan design. This analysis is provided for educational purposes and does not constitute financial, legal, or benefits consultation advice.
About the Author: Sam Newland, CFP®, has spent 13+ years in the employee benefits industry and founded Business Insurance Health and PEO4YOU to bring transparency to an industry that profits from complexity. His approach is simple: show employers the real numbers and let them decide.
Recent Posts

March 9, 2026


March 9, 2026

March 5, 2026

March 4, 2026
March 3, 2026

March 2, 2026
Get In Touch— We’re available 24/7
"*" indicates required fields
“We respect your privacy. Your contact information will be used solely for the purpose of responding to your inquiry and will not be shared with third parties.”
Click To Open Modal
Get In Touch— We’re available 24/7
"*" indicates required fields
“We respect your privacy. Your contact information will be used solely for the purpose of responding to your inquiry and will not be shared with third parties.”
Thanks!
We will be in touch soon.
If you're looking to book a consultation now
Affordable health and benefits plans for small businesses, freelancers, and independent contractors.

Copyright © 2026. Peo4you. All rights reserved.