

For every dollar a mid-size manufacturer spends on a production worker's salary, 40 cents goes to health benefits -- and when that ratio crosses 35%, turnover spikes. The result: employers pay twice. Once in premiums that consume nearly half of total compensation. And again in replacement costs when workers leave for better benefits. For a 100-employee manufacturer, the combined annual cost exceeds $2.1 million.
Two economic forces are converging on mid-size employers in construction, manufacturing, and transportation -- and neither gets enough attention in isolation.
The first force is the relentless rise of per-employee health costs. Mercer's 2026 National Survey projects total health benefit costs exceeding $16,500 per employee, a 6.5% increase and the steepest since 2010. Aon's parallel forecast: 9.5% growth, pushing costs above $17,000 per employee. The KFF's 2025 Employer Health Benefits Survey reports the average employer contribution for family coverage at $20,143 per year (74% of $26,993), while single coverage averages $7,885. Over five years, family premiums have risen 26%.
The second force is wage stagnation in blue-collar industries relative to benefits costs. BLS May 2024 data: median annual wage for production/manufacturing workers is $45,960; transportation workers $42,740; construction laborers $46,050. The national median across all occupations is $49,500.
When you divide employer health cost per employee by the worker's wage, you get the Benefits-to-Wage Ratio -- and in blue-collar industries, this ratio has crossed a critical threshold.
The Benefits-to-Wage Ratio measures how much of a worker's total compensation is consumed by employer-paid health benefits. Below 20%, benefits are a retention tool. Above 35%, they become a cost burden that triggers a paradoxical cycle: employers cut or shift costs, workers perceive degraded compensation, turnover increases, and replacement costs exceed the savings.
| Industry | Median Wage | Health Cost/Employee | B-to-W Ratio | Turnover Rate |
|---|---|---|---|---|
| Manufacturing | $45,960 | $18,500 | 40.3% | 28-35% |
| Transportation | $42,740 | $18,500 | 43.3% | 72% (truckload) |
| Construction | $58,360 | $18,500 | 31.7% | 56% |
| Oil & Energy | $62,400 | $18,500 | 29.6% | 18-25% |
| Technology (comparison) | $120,000 | $18,500 | 15.4% | 13% |
| All Industries (median) | $49,500 | $18,500 | 37.4% | 22% |
Sources: BLS May 2024 OEWS (wages); Mercer/Aon 2026 projections (health cost); SHRM, ABC, ATA (turnover). Employer health cost is projected 2026 average.
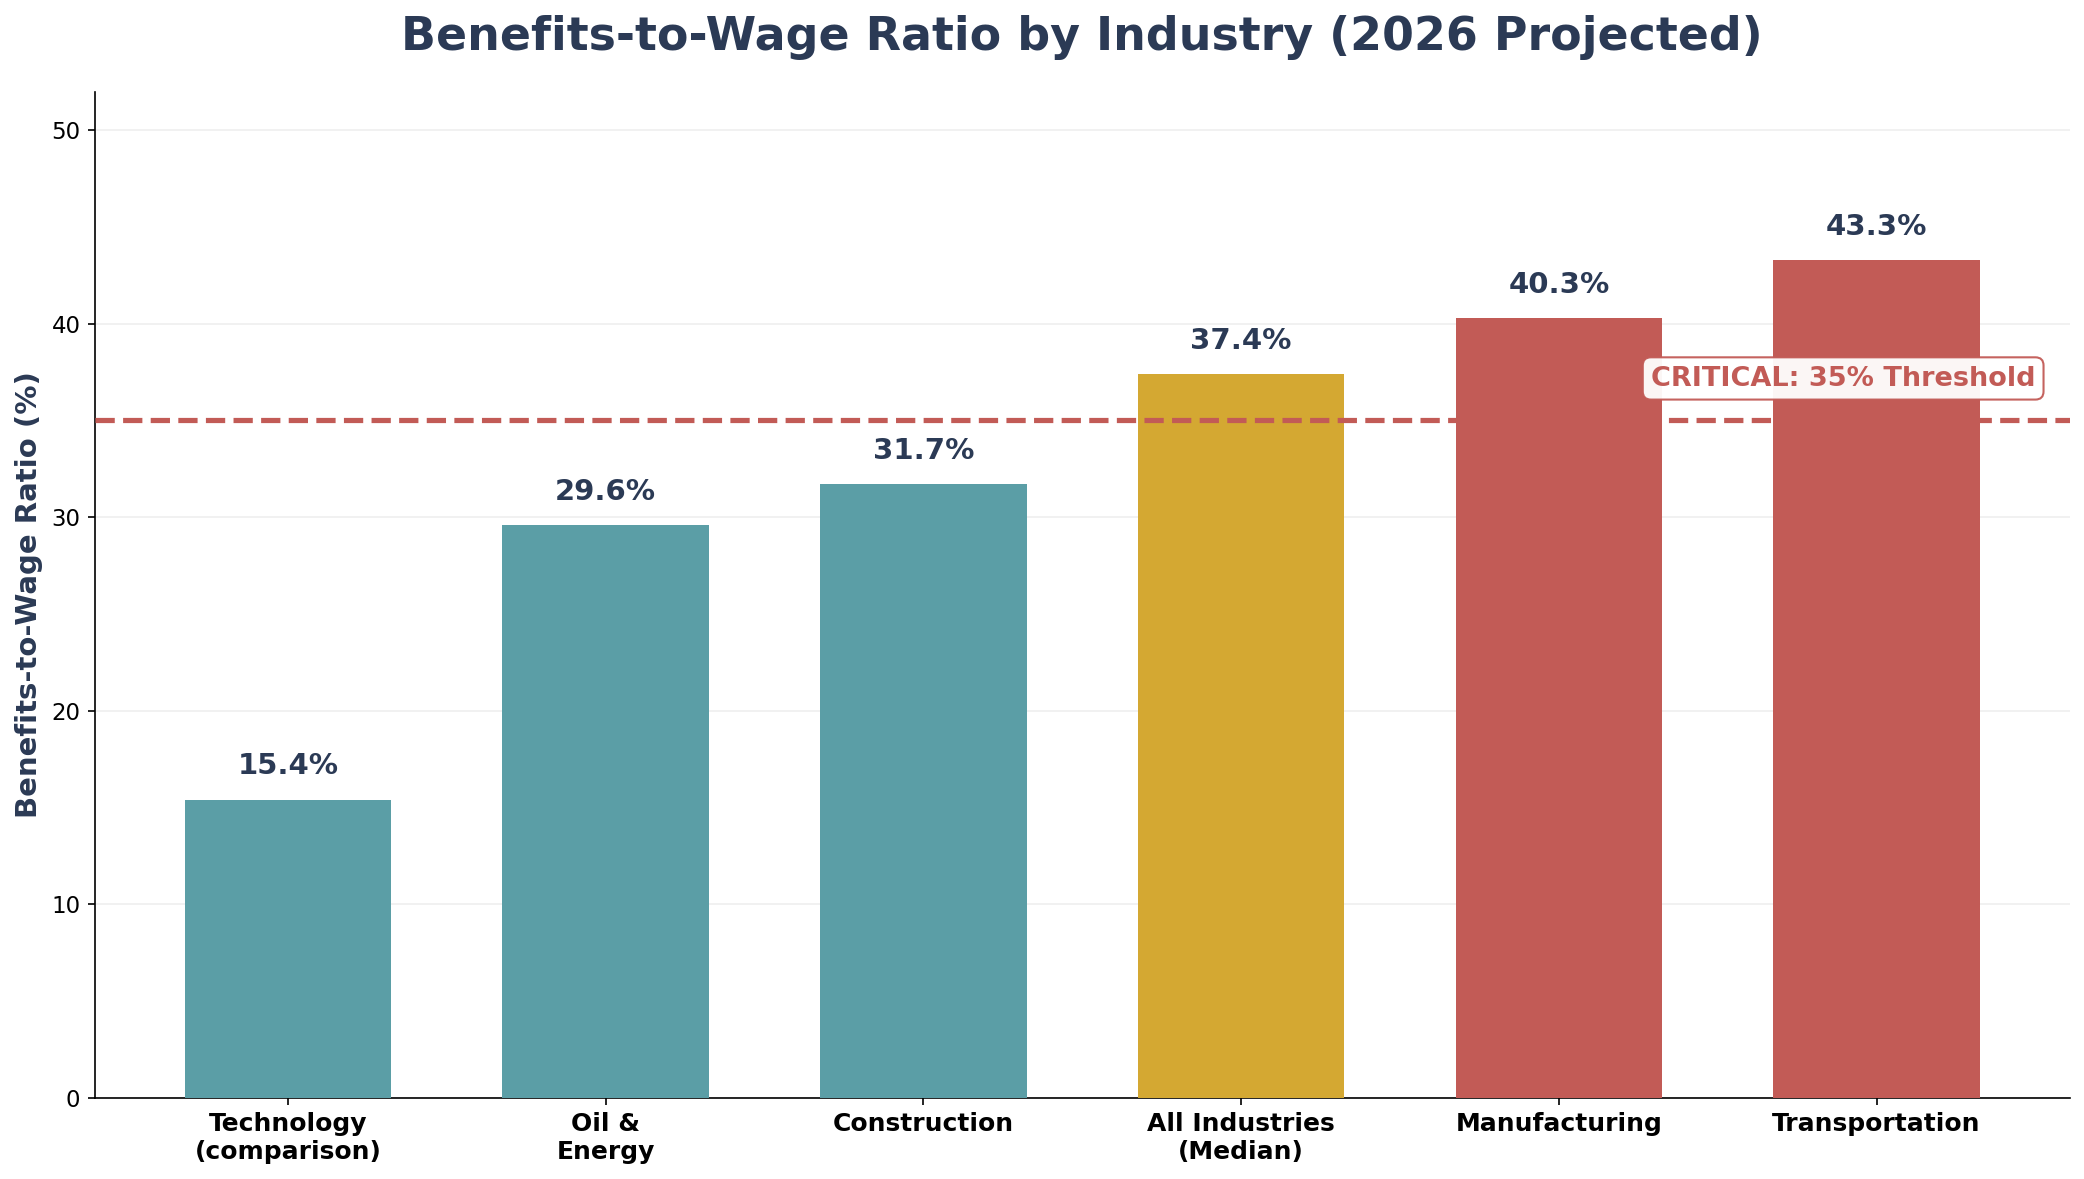
A manufacturing worker at $45,960 generates a 40.3% ratio -- meaning for every dollar on wages, the employer spends 40 cents on health benefits alone. For transportation at $42,740, the ratio climbs to 43.3%. Compare to tech at $120,000: the same $18,500 is just 15.4% of compensation.
Model: 100-employee mid-size manufacturing firm
| Cost Category | Annual Amount | % of Total |
|---|---|---|
| Total Payroll (100 x $45,960) | $4,596,000 | 65.0% |
| Employer Health Premium Share | $1,071,379 | 15.2% |
| Turnover Replacement (30 x $34,470) | $1,034,100 | 14.6% |
| Other Benefits (dental, vision, 401k) | $367,200 | 5.2% |
| TOTAL | $7,068,679 | 100% |
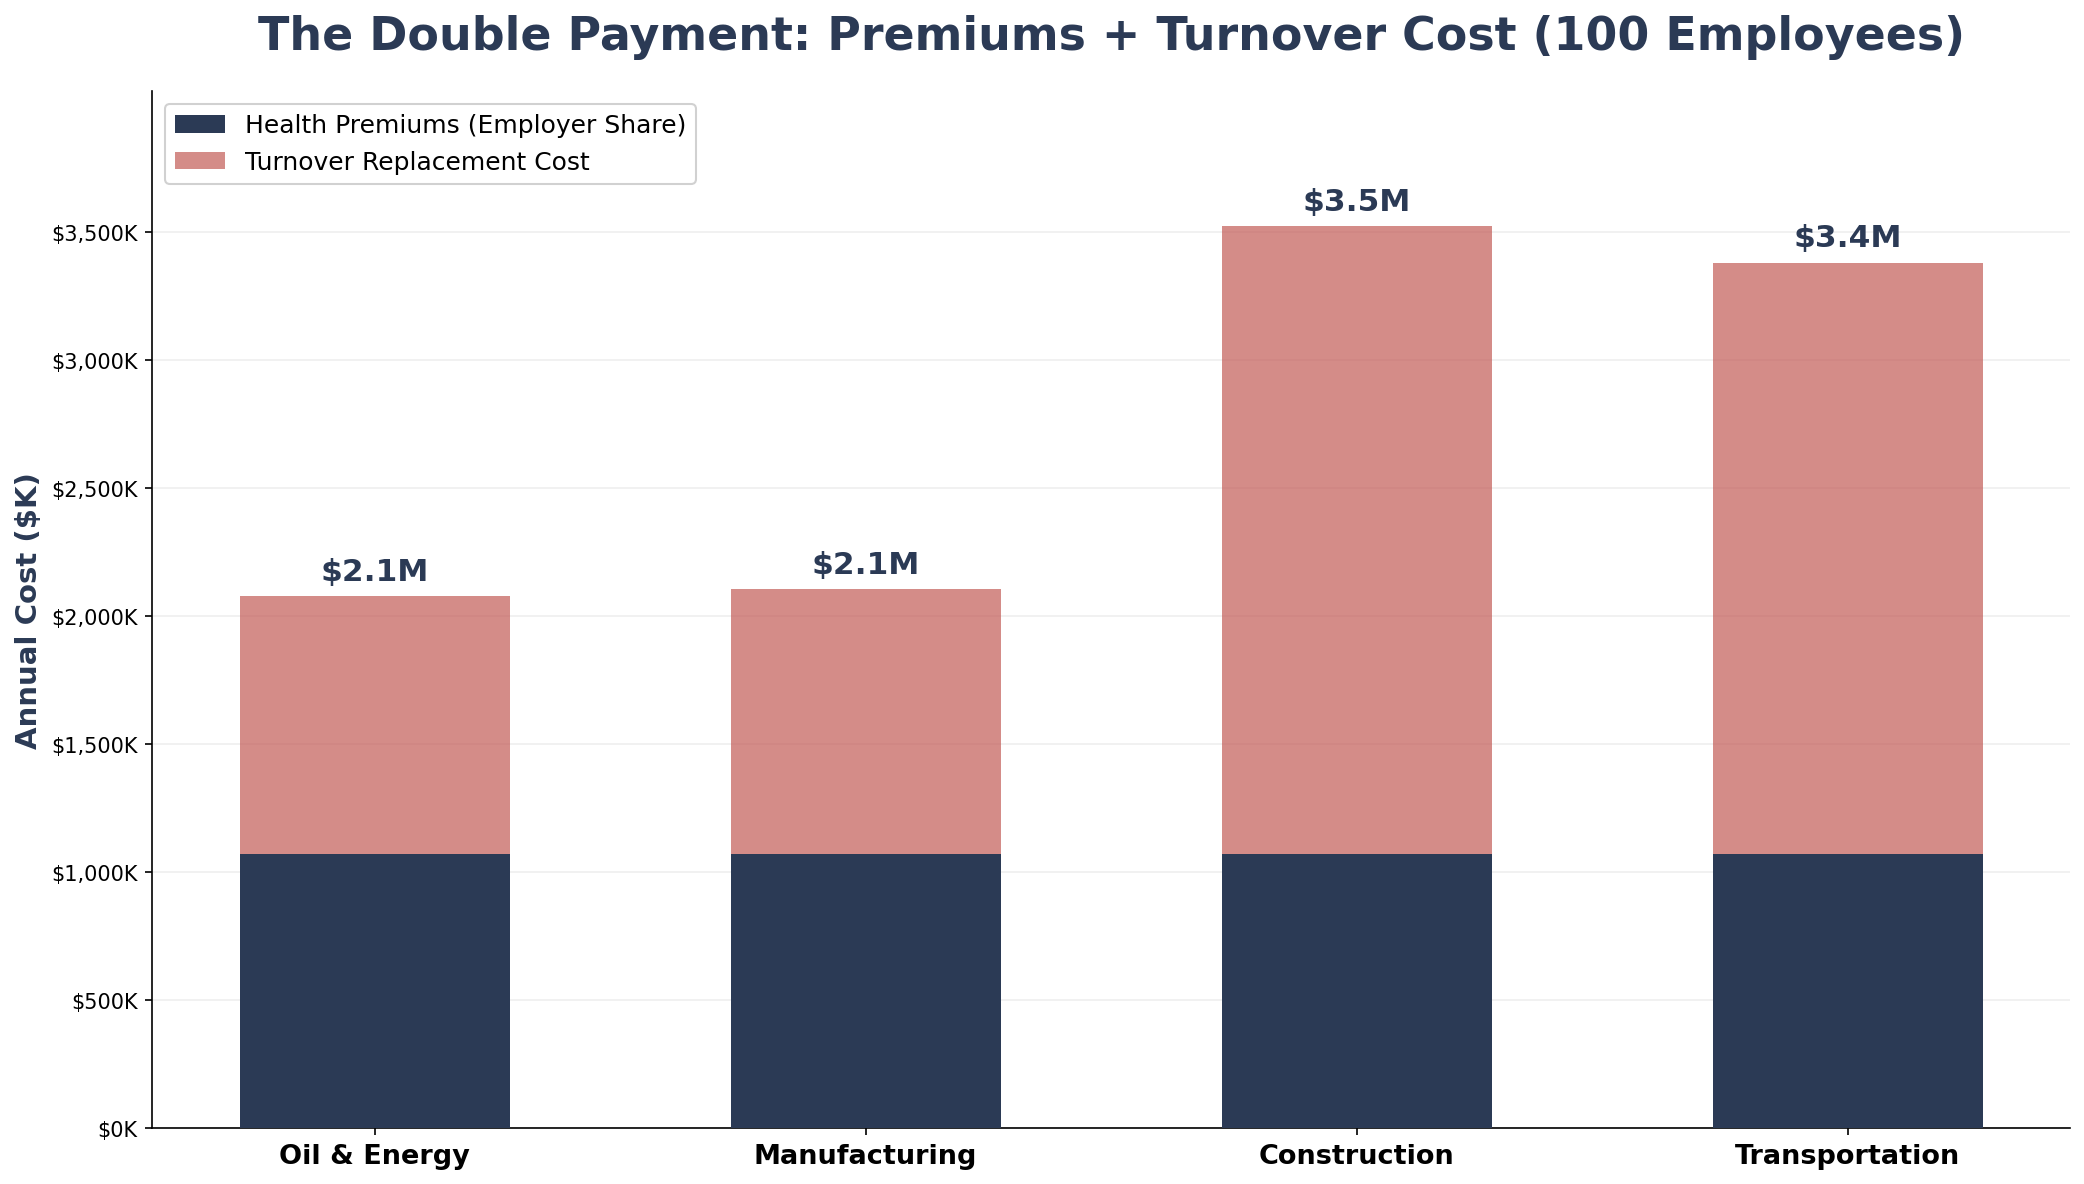
The employer pays $1,071,379 in health premiums AND $1,034,100 in turnover costs -- a combined $2,105,479 in non-productive expenditure. That is 29.8% of total compensation going to insurance and replacement rather than wages, training, or growth.
The link between benefits quality and retention is well-documented:
When employers respond to rising premiums by shifting costs to workers, they trigger the very turnover they're trying to avoid. Replacement costs often exceed the benefit cuts that caused them.
The solution is not to cut benefits -- it is to fund them differently.
| Strategy | Est. Trend | Year 1 Base Cut | 1-Year Savings | 3-Year Cumulative |
|---|---|---|---|---|
| Self-Funded | 3.5% | 8% | $115,825 | $405,000 |
| Level-Funded | 3.0% | 6% | $86,869 | $325,000 |
| PEO (via PEO4YOU) | 3.5% | 7% | $101,347 | $370,000 |
| Captive Consortium | 3.2% | 9% | $130,303 | $445,000 |
| Taft-Hartley Trust | 2.5% | 10% | $144,781 | $510,000 |
| Scenario | Turnover Reduction | Fewer Departures/Yr | Annual Savings | 3-Year Cumulative |
|---|---|---|---|---|
| Conservative | 15% | 4.5 workers | $155,115 | $465,345 |
| Moderate | 20% | 6 workers | $206,820 | $620,460 |
| Aggressive | 25% | 7.5 workers | $258,525 | $775,575 |
Based on 30 departures/year x $34,470 replacement cost. Turnover reduction per SHRM/Gallup research.
| Strategy + Scenario | Premium Savings (3-yr) | Turnover Savings (3-yr) | Total 3-Year |
|---|---|---|---|
| Self-Funded + Conservative | $405,000 | $465,345 | $870,345 |
| Captive + Moderate | $445,000 | $620,460 | $1,065,460 |
| Taft-Hartley + Aggressive | $510,000 | $775,575 | $1,285,575 |
| Metric | Construction | Impact |
|---|---|---|
| Median wage | $58,360 | Highest blue-collar; ratio at 31.7% |
| Annual turnover (ABC) | 56% | Among highest of any industry |
| Replacement cost/worker | $43,770 | Skilled trades premium |
| Annual turnover cost (100 emp) | $2,451,120 | 56 departures x $43,770 |
Construction's higher wages keep the ratio below 35%, but 56% turnover generates enormous replacement costs. A benefits redesign reducing turnover by 15% saves $367,650 annually in replacement costs alone.
| Metric | Manufacturing | Impact |
|---|---|---|
| Median wage | $45,960 | Below national median |
| Benefits-to-Wage Ratio | 40.3% | CRITICAL: well above 35% |
| Annual turnover | 28-35% | Rising since 2020 |
| Annual turnover cost (100 emp) | $1,034,100 | 30 departures x $34,470 |
Manufacturing is ground zero for the Squeeze. With 40.3% ratio, production workers are acutely sensitive to any benefit reduction. Moving to self-funded or captive structures lowers employer costs without degrading plan quality.
| Metric | Transportation | Impact |
|---|---|---|
| Median wage | $42,740 | Lowest among target sectors |
| Benefits-to-Wage Ratio | 43.3% | CRITICAL: highest of all |
| Annual turnover (ATA) | 72% truckload | Industry-leading |
| Annual turnover cost (100 emp) | $2,307,960 | 72 departures x $32,055 |
Transportation faces the most extreme squeeze: lowest wages, highest ratio (43.3%), highest turnover. PEO and Taft-Hartley structures pool risk across small fleets for cost stability.
Most brokers focus exclusively on the premium renewal -- negotiating a 2-3 point reduction and calling it a win. They rarely model the total cost of benefits including turnover impact.
Three structural reasons: First, broker compensation is tied to premium volume (5-8% commission). Lower premiums = lower income. Second, most lack analytical tools to model the benefits-turnover relationship. Third, alternative funding structures require specialized expertise most retail brokers don't possess.
The result: thousands of mid-size employers absorb rising premiums, shift costs to workers, watch turnover climb, and pay replacement costs -- never seeing the full picture.
Assumptions: (1) Employer health cost $18,500/employee (Mercer/Aon 2026 weighted average). (2) Wages from BLS May 2024 OEWS medians. (3) Turnover: ABC (construction 56%), NAM/SHRM (manufacturing 28-35%), ATA (transportation 72% truckload). (4) Replacement cost: 75% of salary (SHRM midpoint of 50-200% range). (5) Turnover reduction 15-25% per SHRM/Gallup research. (6) Alternative funding: 6-10% Year 1 base reduction, 2.5-3.5% annual trend. (7) Model employer: 100 employees, 70% participation, 45 family/25 single. This analysis is provided for educational purposes and does not constitute financial, legal, or benefits consultation advice.
About the Author: Sam Newland, CFP®, has spent 13+ years in the employee benefits industry and founded Business Insurance Health and PEO4YOU to bring transparency to an industry that profits from complexity. His approach is simple: show employers the real numbers and let them decide.
Recent Posts

March 10, 2026


March 10, 2026

March 9, 2026

March 9, 2026

March 5, 2026

March 4, 2026
Get In Touch— We’re available 24/7
"*" indicates required fields
“We respect your privacy. Your contact information will be used solely for the purpose of responding to your inquiry and will not be shared with third parties.”
Click To Open Modal
Get In Touch— We’re available 24/7
"*" indicates required fields
“We respect your privacy. Your contact information will be used solely for the purpose of responding to your inquiry and will not be shared with third parties.”
Thanks!
We will be in touch soon.
If you're looking to book a consultation now
Affordable health and benefits plans for small businesses, freelancers, and independent contractors.

Copyright © 2026. Peo4you. All rights reserved.