

Key Takeaways
Your renewal just came in at 19%. Your broker's recommendation: absorb it and "hope next year is better." Or switch carriers and start the cycle over.
If this sounds familiar, you're living in the fully insured trap. You're paying premiums based on the carrier's book of business, not your actual claims experience. And every year, the carrier keeps the spread between what you paid and what they paid out in claims.
At some point, the math stops making sense. The question is: when exactly is that point?
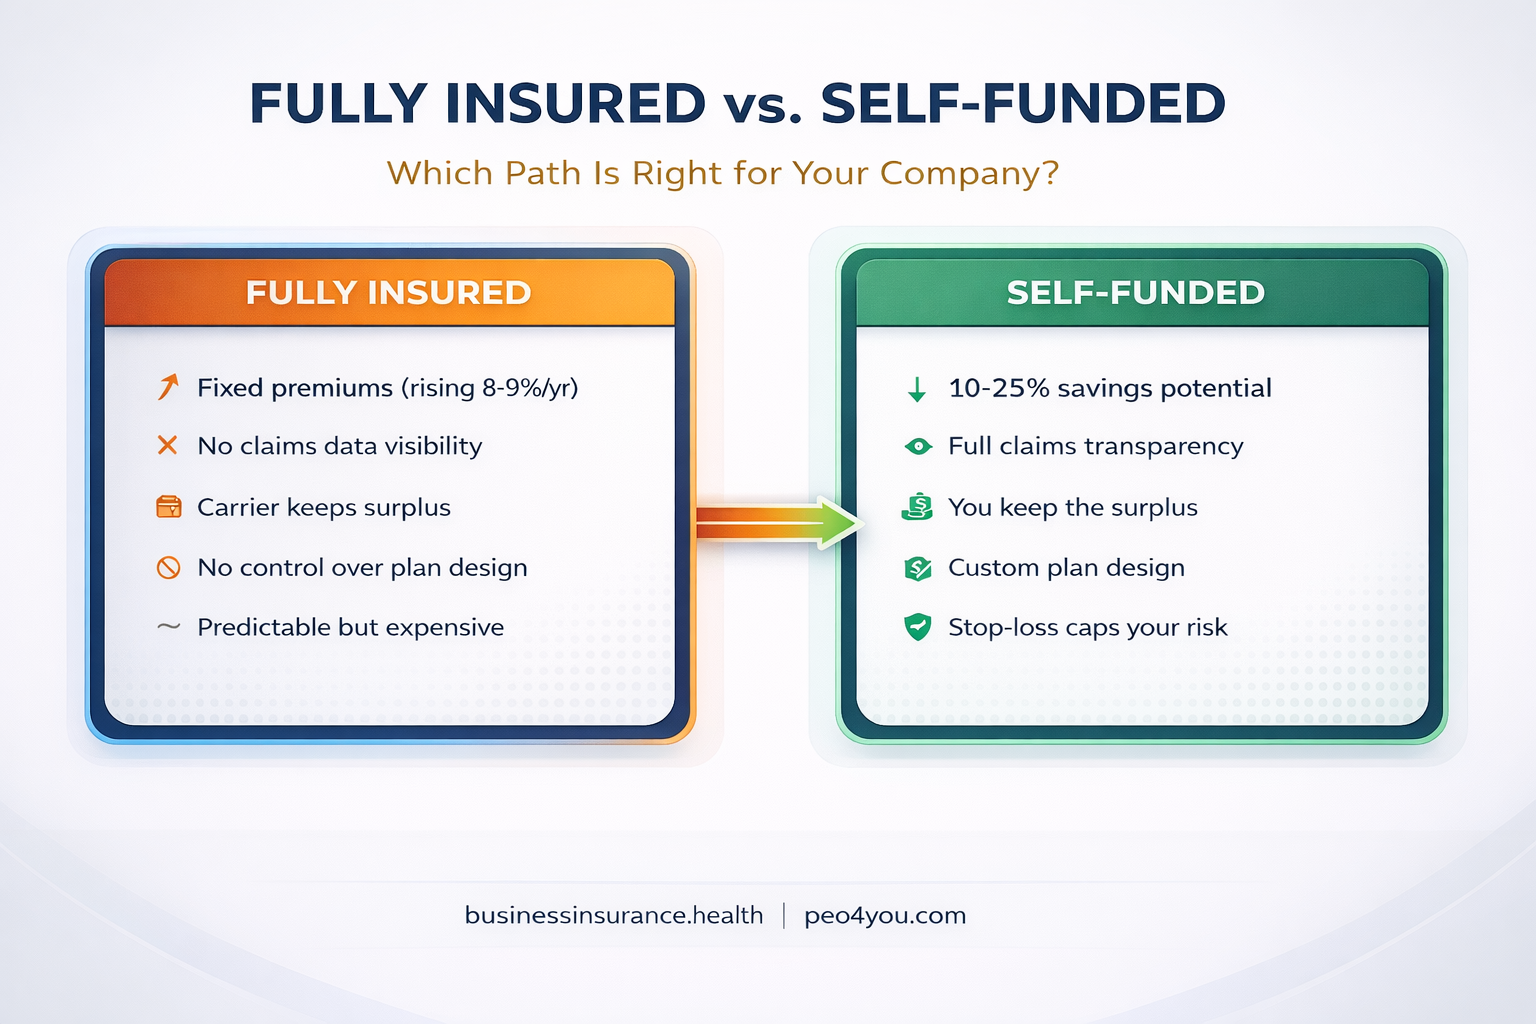
In a fully insured arrangement, you pay a fixed premium to an carrier. The carrier assumes all the risk. If your employees have a good year with low claims, the carrier keeps the surplus. If claims are high, the carrier absorbs the loss. You get predictability but zero upside.
In a self-funded arrangement, your company pays employee health claims directly. You hire a third party administrator (TPA) to process claims, and you purchase stop-loss coverage to cap your maximum exposure. If your employees have a healthy year, you keep the savings. If claims spike, the stop-loss kicks in.
The fear most employers have is catastrophic claims. What if someone gets cancer? What if there's a $500,000 hospital stay? That's what stop-loss coverage is for. It comes in two forms:²
With proper stop-loss in place, your maximum downside in a self-funded plan is defined and insured. The difference is that in good years, you get the upside instead of the carrier.
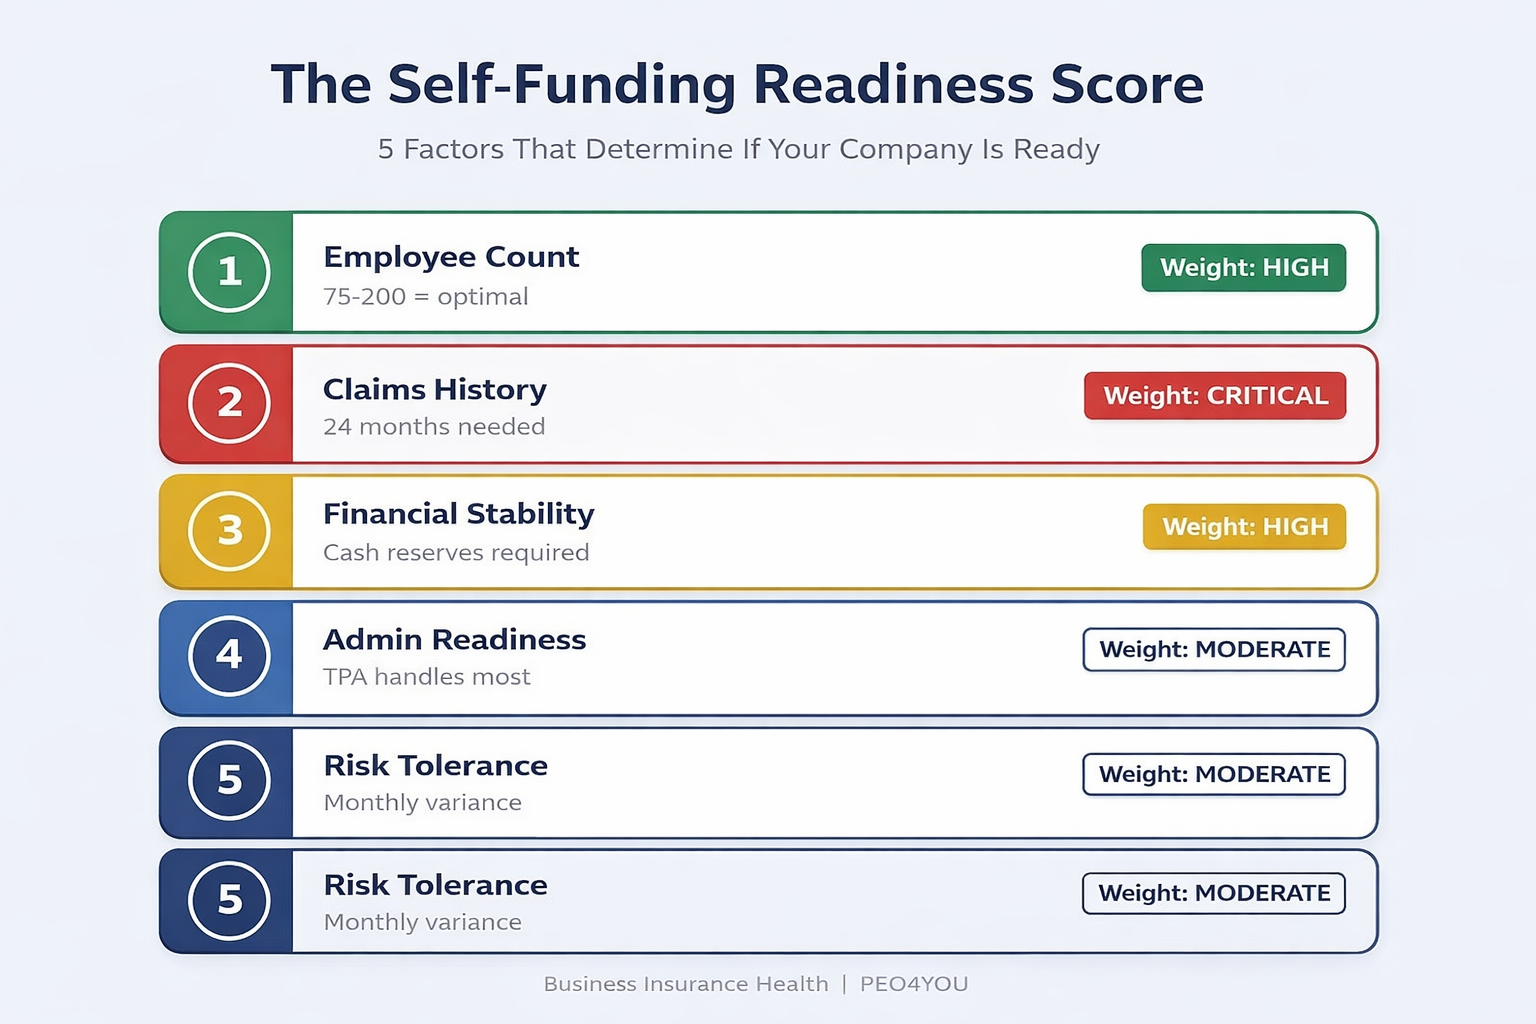
Not every company should self-fund. In our practice, we evaluate five factors before recommending a transition. We call this The Self-Funding Readiness Score.
The math works better with more lives in the risk pool.
| Employees | Self-Funding Viability | Recommended Path |
|---|---|---|
| Under 25 | Low (too much volatility) | PEO or Taft-Hartley multiemployer plan |
| 25 to 50 | Moderate (with captive) | Group captive or level-funded |
| 50 to 100 | Good | Level-funded or standalone self-funded |
| 100 to 200 | Strong | Standalone self-funded with stop-loss |
| 200+ | Optimal | Full self-funded, potentially with captive for stability |
According to the KFF 2025 Employer Health Benefits Survey, 27% of covered workers at firms with 10 to 199 employees are in self-funded plans, up from the prior year.¹ The trend is clear: smaller companies are moving toward self-funding, but they're doing it through intermediate structures like level-funded plans and group captives.
You need data before you make this decision. Specifically, you need 24 months of claims data, ideally at a per-employee level (anonymized for privacy).
Here's the problem: if you're fully insured, your carrier owns that data. Some carriers will share it, some won't. If your carrier won't provide claims data, that alone tells you something about the relationship.
What you're looking for:
Self-funding requires cash flow management. Monthly contributions to the claims fund replace fixed premiums. In months with high claims, you pay more. In low-claims months, you pay less.
Your company needs:
Self-funded plans require more active management than fully insured:
The good news: most TPAs and benefits consultants handle this. The administrative burden is real but manageable. Companies already using a PEO or sophisticated HRIS system typically transition smoothly.
Some leadership teams genuinely prefer the predictability of fully insured, even at a premium. That's a valid choice. Self-funding requires comfort with:
This is the part most brokers skip. They present self-funding as a binary choice: either you're fully insured or you're self-funded. In reality, there's a spectrum of options between the two extremes.
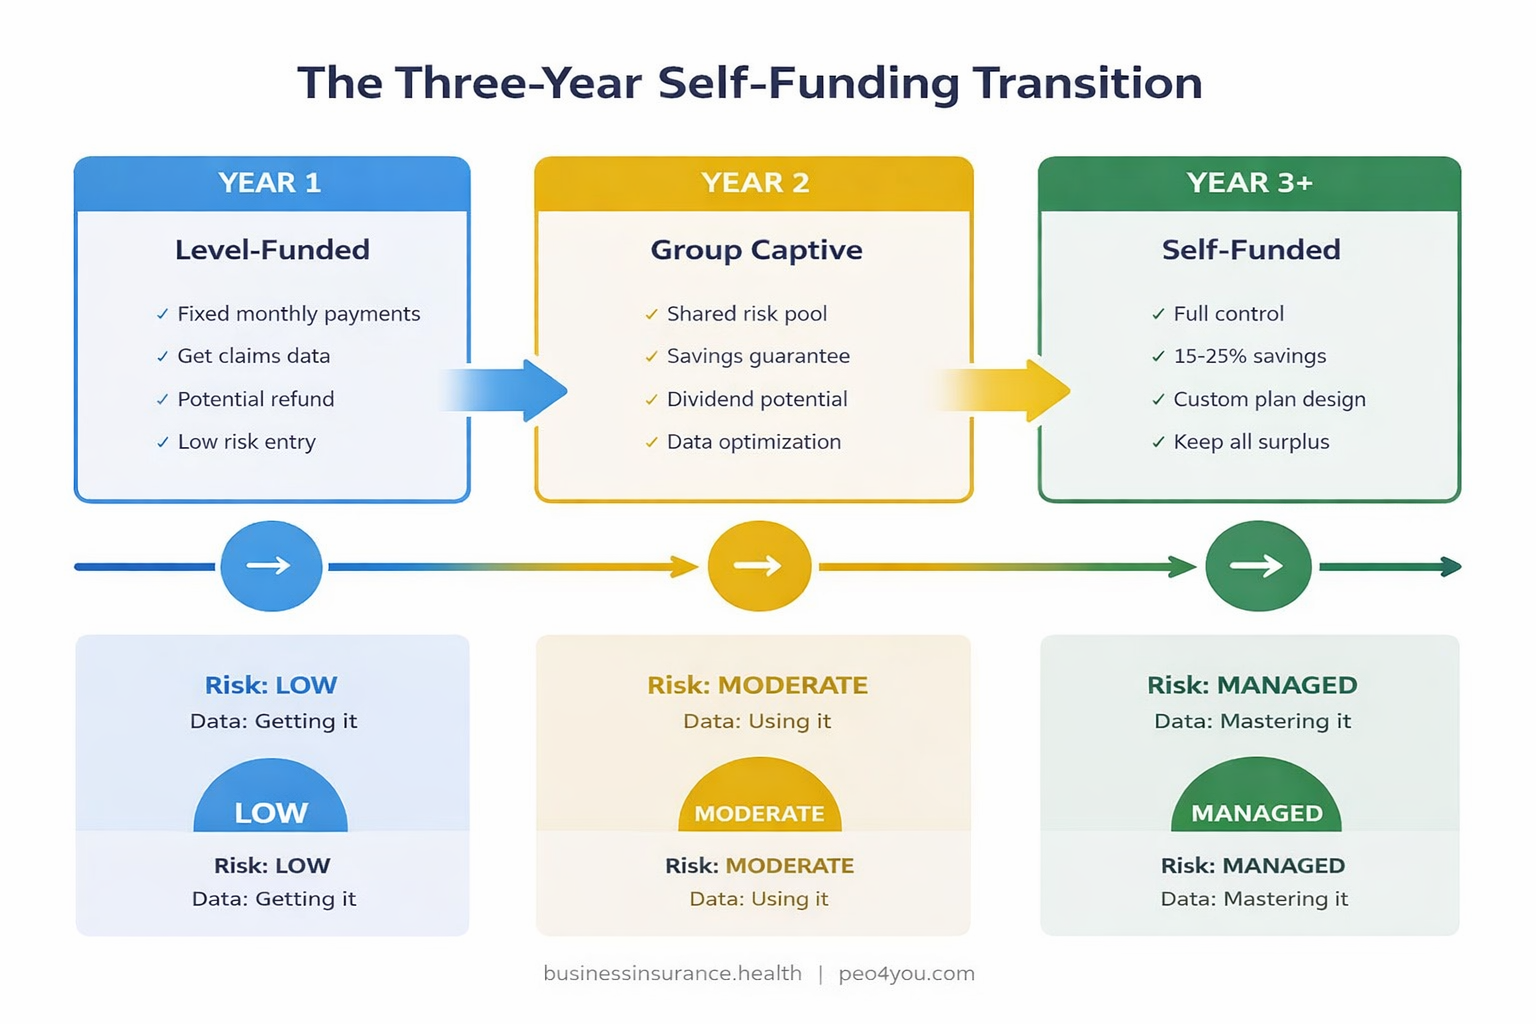
A level-funded plan gives you fixed monthly premiums like fully insured, but with self-funded economics underneath. If claims are low, you get a refund. If claims are high, the stop-loss kicks in.
This is the lowest risk entry point. You get claims data transparency (which you need for the eventual full self-funded transition) without the monthly variability. Companies with 25 to 75 employees often start here.
In a group captive, multiple companies pool their self-funded plans together. This creates a larger risk pool, which stabilizes costs. The captive typically comes with:
Companies with 50 to 150 employees often find group captives hit the sweet spot between self-funding savings and fully insured stability.
A Taft-Hartley multiemployer health plan pools thousands of employees across hundreds of employers. The trust negotiates carrier rates, manages plan design, and spreads risk across the entire pool. Premium increases have averaged 3% or less for six consecutive years in some established trusts, compared to the 6% to 8% average for fully insured small group plans.¹
This option works for companies as small as 5 enrolled employees and provides the cost stability of self-funding without any of the administrative complexity.
📊 STRESS TEST YOUR RENEWAL
Premium Renewal Stress Test at businessinsurance.health — model your renewal across five funding strategies over six years.
No login required. No email gate. Free.
Like this tool? We built five more just like it — all free, all ungated. Explore all tools at Business Insurance Health.
Let's walk through a realistic scenario based on the types of transitions we model for clients.
| Parameter | Value | Source |
|---|---|---|
| Industry | Professional services | Scenario |
| Employees | 150 (growing to 190) | Scenario |
| Current plan | Fully insured PPO | Scenario |
| Current annual premium | ~$2.2M | Based on KFF avg $9,325 single × 150 × blended¹ |
| Recent renewal increase | 19% | Scenario based on market conditions |
| Carrier loss ratio | Unknown (carrier won't share) | Common scenario |
| Component | Fully Insured (Status Quo) | Self-Funded (Year 1) |
|---|---|---|
| Expected claims | Included in premium | $1.5M to $1.8M (estimated at 75% of premium) |
| Stop-loss premium | N/A | $180,000 to $250,000 |
| TPA and admin fees | Included | $80,000 to $120,000 |
| Total expected cost | $2,200,000 | $1,760,000 to $2,170,000 |
| Potential savings | — | $30,000 to $440,000 |
| Claims data access | No | Yes (monthly reporting) |
| Surplus if claims are low | Kept by carrier | Kept by employer |
BIH model estimate. Savings range reflects variance between high-claims and low-claims scenarios. Stop-loss and admin fee ranges based on market rates for groups of 100 to 200 employees.
The conservative end of that range might look underwhelming. That's intentional. Year 1 of self-funding isn't always about dramatic savings. It's about getting claims data that lets you optimize Year 2 and beyond.
By Year 3, companies with active claims management, pharmacy benefit carve-outs, and strategic plan design changes typically see 15% to 25% lower costs compared to where they would have been staying fully insured.³
A 19% renewal increase feels like a reason to self-fund. But if your claims actually warrant that increase (meaning your loss ratio was over 100%), self-funding won't magically reduce your claims. You'd be taking on the same risk the carrier is pricing for.
Always get claims data first. If the carrier won't share it, use the transition year to move to a level-funded plan that provides data, then make the self-funded decision with 12 months of actual claims information.
Stop-loss is the safety net of self-funding. Setting the specific deductible too high ($200,000+ per individual) to save on premium can backfire catastrophically if multiple employees have serious claims in the same year. For companies under 200 employees, specific stop-loss deductibles of $50,000 to $125,000 provide the right balance of savings and protection.
The biggest advantage of self-funding isn't Year 1 savings. It's the compounding effect of claims data over time. Companies that build a three-year transition plan (level-funded → group captive → standalone self-funded) consistently outperform those that make a single leap.
If you're exploring health plan strategies for small manufacturers or any industry where turnover and workforce health matter, this phased approach is even more critical.
Self-funding isn't universally better. Stay fully insured if:
The worst outcome is switching to self-funded, having a bad claims year, panicking, and switching back to fully insured at an even higher rate. A thoughtful, data-driven transition prevents that scenario.
You can project your costs across seven funding arrangements using the Health Funding Cost Projector at Business Insurance Health to see how each option plays out for your specific situation.
Companies with 50 to 200 employees are in the strongest position for a direct transition to self-funded health coverage. Companies with 25 to 50 employees can access self-funding through group captives or level-funded plans. Below 25 employees, PEO arrangements or Taft-Hartley multiemployer trusts typically provide better economics. The KFF 2025 survey shows 27% of workers at firms with 10 to 199 employees are already in self-funded plans.¹
First-year savings typically range from 5% to 15% for companies with average or better-than-average claims experience. By Year 3, savings of 15% to 25% compared to the fully insured trajectory are common, driven by claims data optimization and plan design improvements. However, in a high-claims year, costs may be comparable to or slightly above fully insured. The key is stop-loss protection to cap downside risk.
This is exactly what stop-loss coverage protects against. Specific stop-loss covers any individual claim above a set threshold (typically $50,000 to $150,000). Aggregate stop-loss caps your total annual claims liability. With properly structured stop-loss, your maximum annual exposure is defined before the plan year starts. You can stress test your renewal across five strategies to see how catastrophic claims affect each funding model.
In most cases, yes. Major carriers like UHC, Aetna, Cigna, and Blue Cross Blue Shield all offer Administrative Services Only (ASO) arrangements where they provide the network and claims processing while the employer self-funds. You can often keep the same network your employees are accustomed to, eliminating the disruption of a carrier switch.
Level-funded plans fix your monthly cost like a fully insured plan but operate as self-funded underneath. If claims are low, you get a refund. If claims are high, stop-loss covers the overage. It's essentially self-funded with training wheels. The main trade-off: level-funded plans are slightly more expensive than pure self-funded because the carrier charges for the guaranteed level payment structure. Read more in our guide to level-funded health coverage for small business.
📊 MODEL YOUR FUNDING OPTIONS
Health Funding Cost Projector at businessinsurance.health — compare seven funding arrangements side by side for your specific headcount and industry.
No login required. No email gate. Free.
Like this tool? We built five more just like it — all free, all ungated. Explore all tools at Business Insurance Health.
1. Kaiser Family Foundation. "2025 Employer Health Benefits Survey." October 2025. https://www.kff.org/health-costs/2025-employer-health-benefits-survey/
2. Self-Insurance Institute of America. "Self-Insured Health Plans: A Primer." SIIA.org. https://www.siia.org/
3. BIH model estimate based on client transition data across groups of 75 to 250 employees over 36 months. Savings reflect the difference between actual self-funded costs and projected fully insured renewal trajectory.
4. Bureau of Labor Statistics. "Employer Costs for Employee Compensation." Q2 2025. https://www.bls.gov/ecec/
5. Managed Healthcare Executive. "The Leap to Self-Insurance." March 2026. https://www.managedhealthcareexecutive.com/view/the-leap-to-self-insurance
6. Roundstone Insurance. "Self-Funded Health Insurance: The Complete Guide." December 2025. https://roundstoneinsurance.com/blog/how-self-funded-health-insurance-works/
7. Marsh McLennan Agency. "Moving from Fully Insured to Self-Funded Insurance." 2025. https://www.marshmma.com/us/insights/details/moving-from-fully-insured-to-self-funded.html
8. KFF. "Annual Family Premiums for Employer Coverage Rise 6% in 2025, Nearing $27,000." October 2025. https://www.kff.org/health-costs/annual-family-premiums-for-employer-coverage-rise-6-in-2025-nearing-27000/
Methodology Note: Cost projections in this article use a blended approach combining KFF 2025 survey data for fully insured benchmarks and BIH client transition data for self-funded cost ranges. The "Model Employer" scenario uses a 75% expected claims-to-premium ratio based on industry averages for groups of 100 to 200 employees. Stop-loss and TPA fee ranges reflect 2025-2026 market rates. All savings projections are presented as ranges. Individual results depend on claims experience, plan design, stop-loss structure, and demographic mix.
This analysis is provided for educational purposes and does not constitute financial or legal advice. Consult your compliance counsel and benefits advisor for guidance specific to your situation.
About the Author
Sam Newland, CFP® is the Founder and President of Business Insurance Health and PEO4YOU. With over 13 years in the employee benefits industry and experience as the former #1 face-to-face health benefits advisor nationally, Sam helps businesses with 30 to 200+ employees navigate funding strategies that most brokers don't present. Contact: [email protected] | 857-255-9394 | businessinsurance.health | peo4you.com
Recent Posts

March 17, 2026


March 17, 2026

March 15, 2026

March 14, 2026
March 14, 2026

March 13, 2026
Get In Touch— We’re available 24/7
"*" indicates required fields
“We respect your privacy. Your contact information will be used solely for the purpose of responding to your inquiry and will not be shared with third parties.”
Click To Open Modal
Get In Touch— We’re available 24/7
"*" indicates required fields
“We respect your privacy. Your contact information will be used solely for the purpose of responding to your inquiry and will not be shared with third parties.”
Thanks!
We will be in touch soon.
If you're looking to book a consultation now
Affordable health and benefits plans for small businesses, freelancers, and independent contractors.

Copyright © 2026. Peo4you. All rights reserved.