

Every dollar you save on employee benefits and HR overhead flows directly to your bottom line. For business owners planning a future exit, that means higher EBITDA, stronger valuation multiples, and more leverage at the negotiating table. Our solutions help you reduce benefits spend, streamline administration, and create a clean, scalable cost structure that buyers and investors value.
See How It Works ↓Here are the 4 in which we specialize and why 70% of clients who request a quote say yes
PEO4YOU is a Taft Hartley plan. Taft Hartley plans pull businesses and sole proprietors together in order to improve rates through shared risk pooling. The money people pay for their health coverage goes into a trust and is regulated by ERISA laws. This requires that money in the fund only go out for medical claims and administration - not for executive profits. The main advantage of this plan is its premium stability where every business gets the same premium increases whether they are healthy or sick. Many clients report smoother claims administration and an enhanced customer service experience. Some clients have saved over 50% on their health premiums.
PEOs are a total business solution that help assist in 5 areas - payroll, HR, compliance, employee benefits, and (sometimes) workers' compensation - which typically helps them outcompete comparable businesses not in a PEO. Due to their structure, they provide unmatched compliance risk management that cannot be duplicated outside of a PEO. For many businesses, they also provide unbeatable health rates and voluntary Fortune 500 employee benefits options without enrollment and participation requirements. Our recommended PEO partners all have client retention rates between 91.8-95% and do not interfere with how ownership wants to run their business. Some clients have saved as much as 52% on their medical through PEOs.
Over the last decade, the popularity of self-funded plans has grown significantly as fully insured rates have skyrocketed. For businesses considered small groups, self funded options allow businesses to be rewarded with lower health-based rates that tend to be lower than fully-insured options. What makes these plans so effective is their customizability. Employers can choose their own TPA, pharmacy benefit manager, specialty med carveouts, direct primary care, etc. This level of customization can slash annual premiums with typical savings of 10-30%. 50% of employers with 20+ employees enrolled can expect savings of at least 25%.
For small groups, fully insured options are based simply on zip code and date of birth. As a result of not being able to determine rates in any other way, the carrier has to assume below average health. This tends to make fully insured advantageous for unhealthy groups. For large groups (ie 50+ FTEs), rates are still health-based. That said, unlike self funded plans, claims data tends to be not shared at all or highly delayed. The advantage for large groups is that the network and claims administrator are the same.
Company Profile: A 26-person construction company based in the upper Midwest, specializing in commercial and residential projects. The owner was focused on building enterprise value over the next 3-5 years, with an eventual sale or partnership as the end goal.
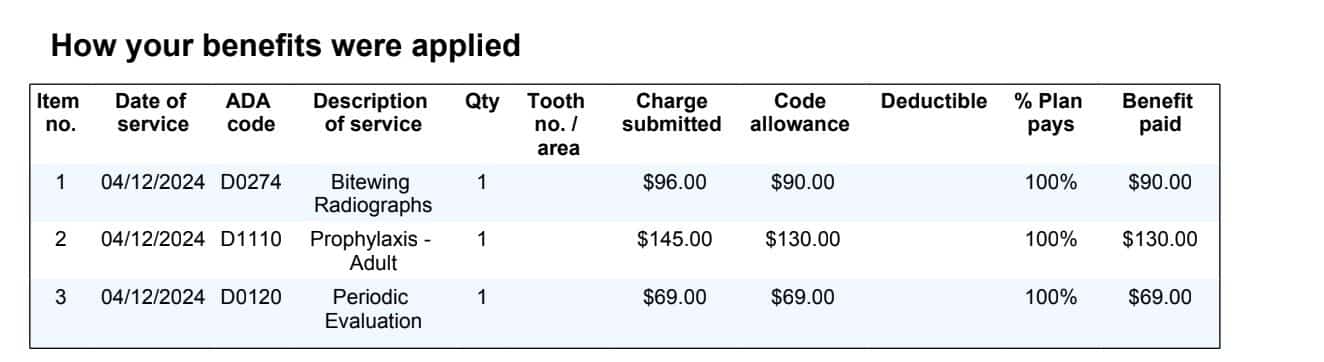
Projected cost: Age-banded individual market rates; older employees (avg. age 35-38) facing premiums of $650-$900+/month
Limitations: Costs tied directly to employee demographics. Annual renewals unpredictable (industry average 8-12% increases). No bundled HR or payroll. Does not address compliance gaps or reduce administrative overhead. From a buyer's perspective, traditional plans represent a volatile, non-optimized cost structure.
✗ Does not address the core valuation objectiveProjected cost: Flat-rate premiums starting at ~$471/month per employee regardless of age
Projected savings: Older employees could save 30-50% on premiums vs. age-banded plans
Strengths: Non-experience-rated premiums, national BCBS PPO network, Gold-level benefits (lower deductibles, lower out-of-pocket maximums). Historically stable 2-3% renewals create a predictable line item for financial projections.
Limitations: Union association requirements (minimum wage thresholds, holiday requirements). Does not bundle workers' comp or full HR administration.
◐ Strong option, but doesn't fully address bundled HR + workers' comp needsAssessment: At 26 employees, the group is too small for standalone self-funding without taking on significant claims volatility risk. A single catastrophic claim could create a major balance sheet event — exactly the kind of unpredictability that suppresses valuation multiples.
✗ Not appropriate at current headcount — revisit at 75-100+ employeesPEO admin fee: ~$22,000/year (flat per-employee-per-week model — no percentage-of-payroll surprises)
Employer health contribution: ~$48,000/year (based on ~$200/month per employee minimum)
Health network: National PPO with 1.5M+ providers — chosen for superior provider access in the company's region
Workers' comp: Bundled with pay-as-you-go billing, eliminating year-end audit surprises
HR services: Payroll, onboarding, compliance management, OSHA support, I-9 verification — all handled by a dedicated service team
When we ran Total Wall's numbers through our Benefits ROI Calculator, the full PEO value breakdown looked like this:
| Impact Area | Annual Value | How Calculated |
|---|---|---|
| Reduced turnover (4 → 2 employees/year) | $98,700 | 2 fewer departures (1.5 typical + 0.5 high-value) |
| High-value talent attraction | $2,000,000 | 1 extra high-value hire × $2M incremental revenue |
| Faster hiring (45 → 30 days) | $23,625 | 15 days saved × 7 hires |
| Improved productivity (85% → 90%) | $67,294 | +5.9% productivity across 22 employees |
| HR admin time recovered (10 hrs/week) | $35,100 | 10 hrs/wk × $50/hr × 52 wks + 35% opportunity cost |
| Compliance risk reduction | $10,000 | 2 active risks eliminated (OSHA, handbook) |
| Workers' comp savings | $9,660 | 35% savings on $27,600 premium |
| Replaced tools & admin savings | $1,320 | Payroll + 1 HR tool consolidated into PEO |
Base Case scenario (100% of projected improvements). Conservative = 70%, Optimistic = 130%. Generated by BusinessInsurance.Health Benefits ROI Calculator. Data sources: KFF 2024, SHRM, BLS JOLTS, MetLife, Willis Towers Watson, Work Institute.
The owner chose the PEO solution not because it was the cheapest option on paper — it wasn't. The PEO4YOU/Taft-Hartley plan would have produced lower monthly premium costs. But the decision was never just about premiums. When we ran the full analysis, the PEO delivered $2.2M+ in projected annual value — a 10,238% return on the $21,935 investment — by addressing turnover, talent attraction, productivity, compliance, and admin overhead simultaneously.
When we ran this company through our Business Valuation Tool, the numbers were clear. With ~$500K in annual EBITDA and a 3.2x industry multiple (BizBuySell range: 2.5x-4.0x for businesses under $5M), the current valuation sat at approximately $1.27M. But the tool flagged a critical risk:
Biggest Valuation Risk
"No/minimal benefits" was costing an estimated -$90,000 in lost value
Poor benefits = high turnover risk = lower valuation
After addressing HR infrastructure gaps across 10 risk categories — compliance, workers' comp, benefits, payroll, documentation, retention, training, multi-state, time tracking, and EPLI — the projected 12-month valuation increased to:
A 20.9% increase in enterprise value and a +0.66x improvement in the valuation multiple — driven by professionalizing the company's HR infrastructure through the PEO solution.
📅 Estimated Value Growth Timeline
They look for:
The bottom line: Two separate analyses told the same story. Our Business Valuation Tool projected a $266,000 increase in enterprise value within 12 months — from $1.27M to $1.54M — by addressing 10 risk categories including "no/minimal benefits" (the single largest risk factor at -$90,000 in lost value). Our Benefits ROI Calculator then quantified the operational impact: $2.2M+ in annual value from reduced turnover, high-value talent attraction, productivity gains, compliance risk elimination, and workers' comp savings — all for a $21,935/year PEO investment. The cost of the solution didn't just pay for itself; it transformed the company's operating profile and exit readiness.
Our free Business Valuation Tool lets you input your EBITDA, payroll, and industry — then walks you through a 10-category Risk & Compliance Assessment covering HR compliance, workers' comp, benefits, payroll accuracy, documentation, retention, training, multi-state, time tracking, and EPLI. You'll get a projected valuation increase with a 3-6-9-12 month growth timeline, scenario toggling (Conservative / Base Case / Optimistic), and adjustable risk sliders to see exactly how each improvement impacts your number.
Try the Business Valuation Tool →Talk to an advisor who will walk you through your options — no pressure, no obligation. Just the numbers and the plan that fits your business.
857-255-9394 [email protected]Affordable health and benefits plans for small businesses, freelancers, and independent contractors.

Copyright © 2026. Peo4you. All rights reserved.